Output
The kind of display you want can be selected from the Output tab on the add/edit report screen.
Tabular
This is the default output type and presents the data in a tabular output.
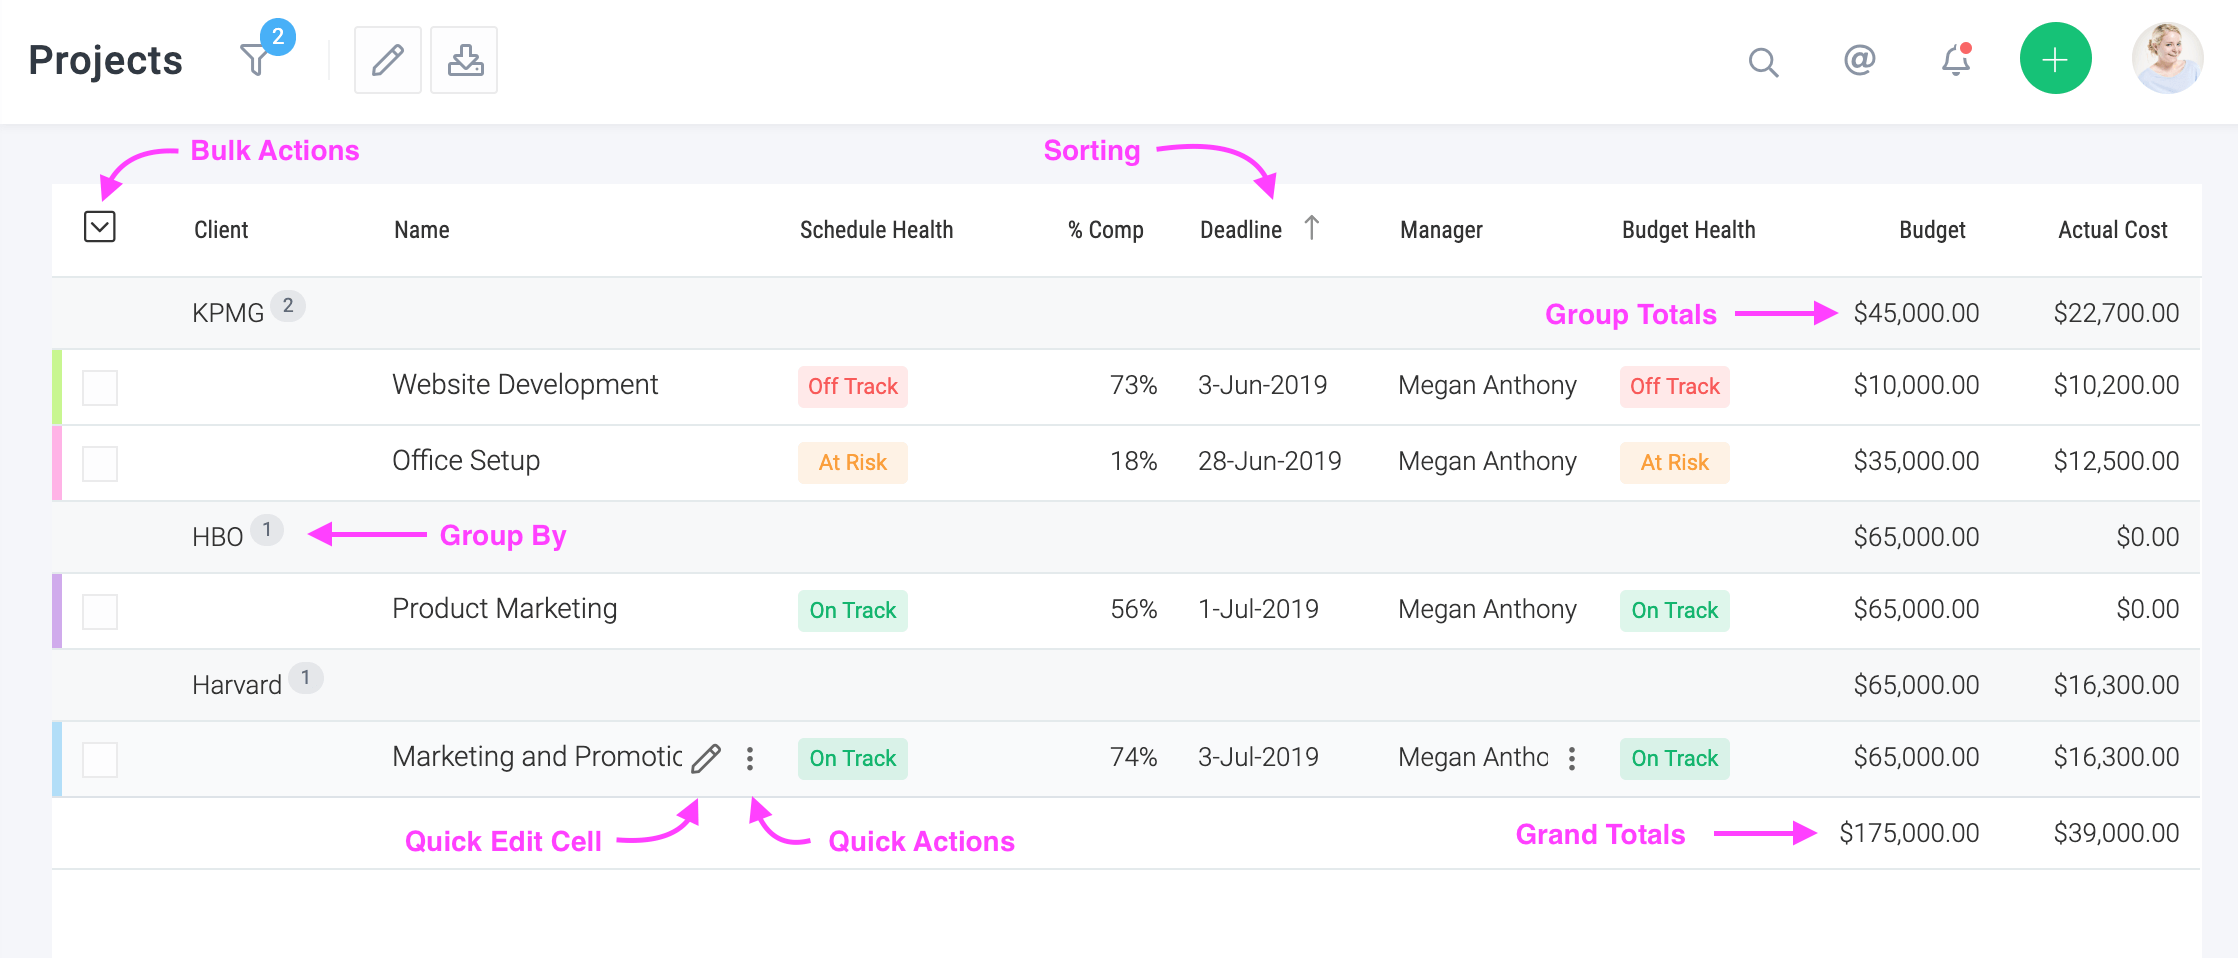
The view is quite dynamic with multi-level grouping and sorting, group totals, grand totals, etc.
This view is highly personalizable - you can change columns, grouping and sorting to suit your needs. See the top right hand side of the image above.
This view also has great productivity boosters. You can do bulk actions, perform an action on a line item by clicking the icon and even edit an attribute right there by clicking on the icon.
OnlyTotals
Show the total rows only. If the option was checked in the above report. You would only see the group and grant total rows and not the individual project rows.
TaskReportHierarchical
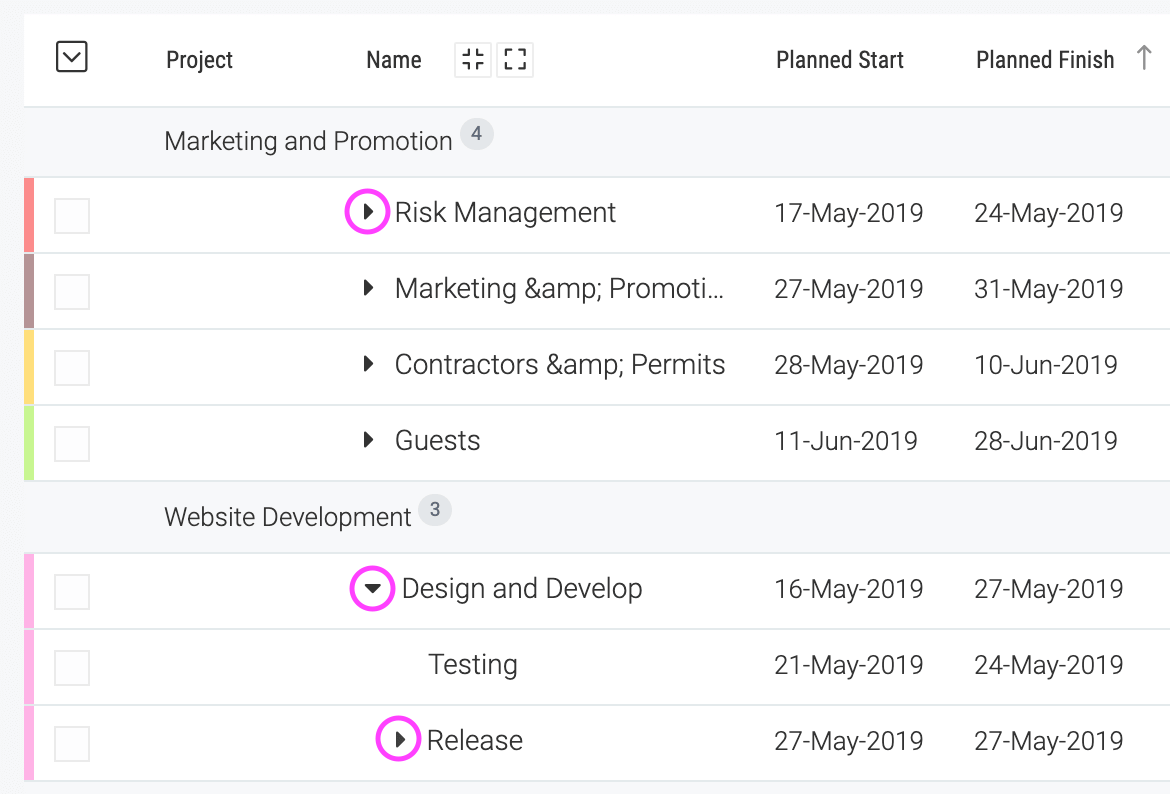
This organizes the row as per the parent-child relationship. It is only available for task, file and client reports. View this example that shows tasks grouped by project with the hierarchical option checked.
When this option is checked, the resulting totals only include those objects that result from the filters not the objects included (even if they don't match the filters) to show the hierarchy.
Hide Header Row
This option will hide the row showing the column names. It is handy when data is displayed on Status dashboards, and the column names do not really add value.
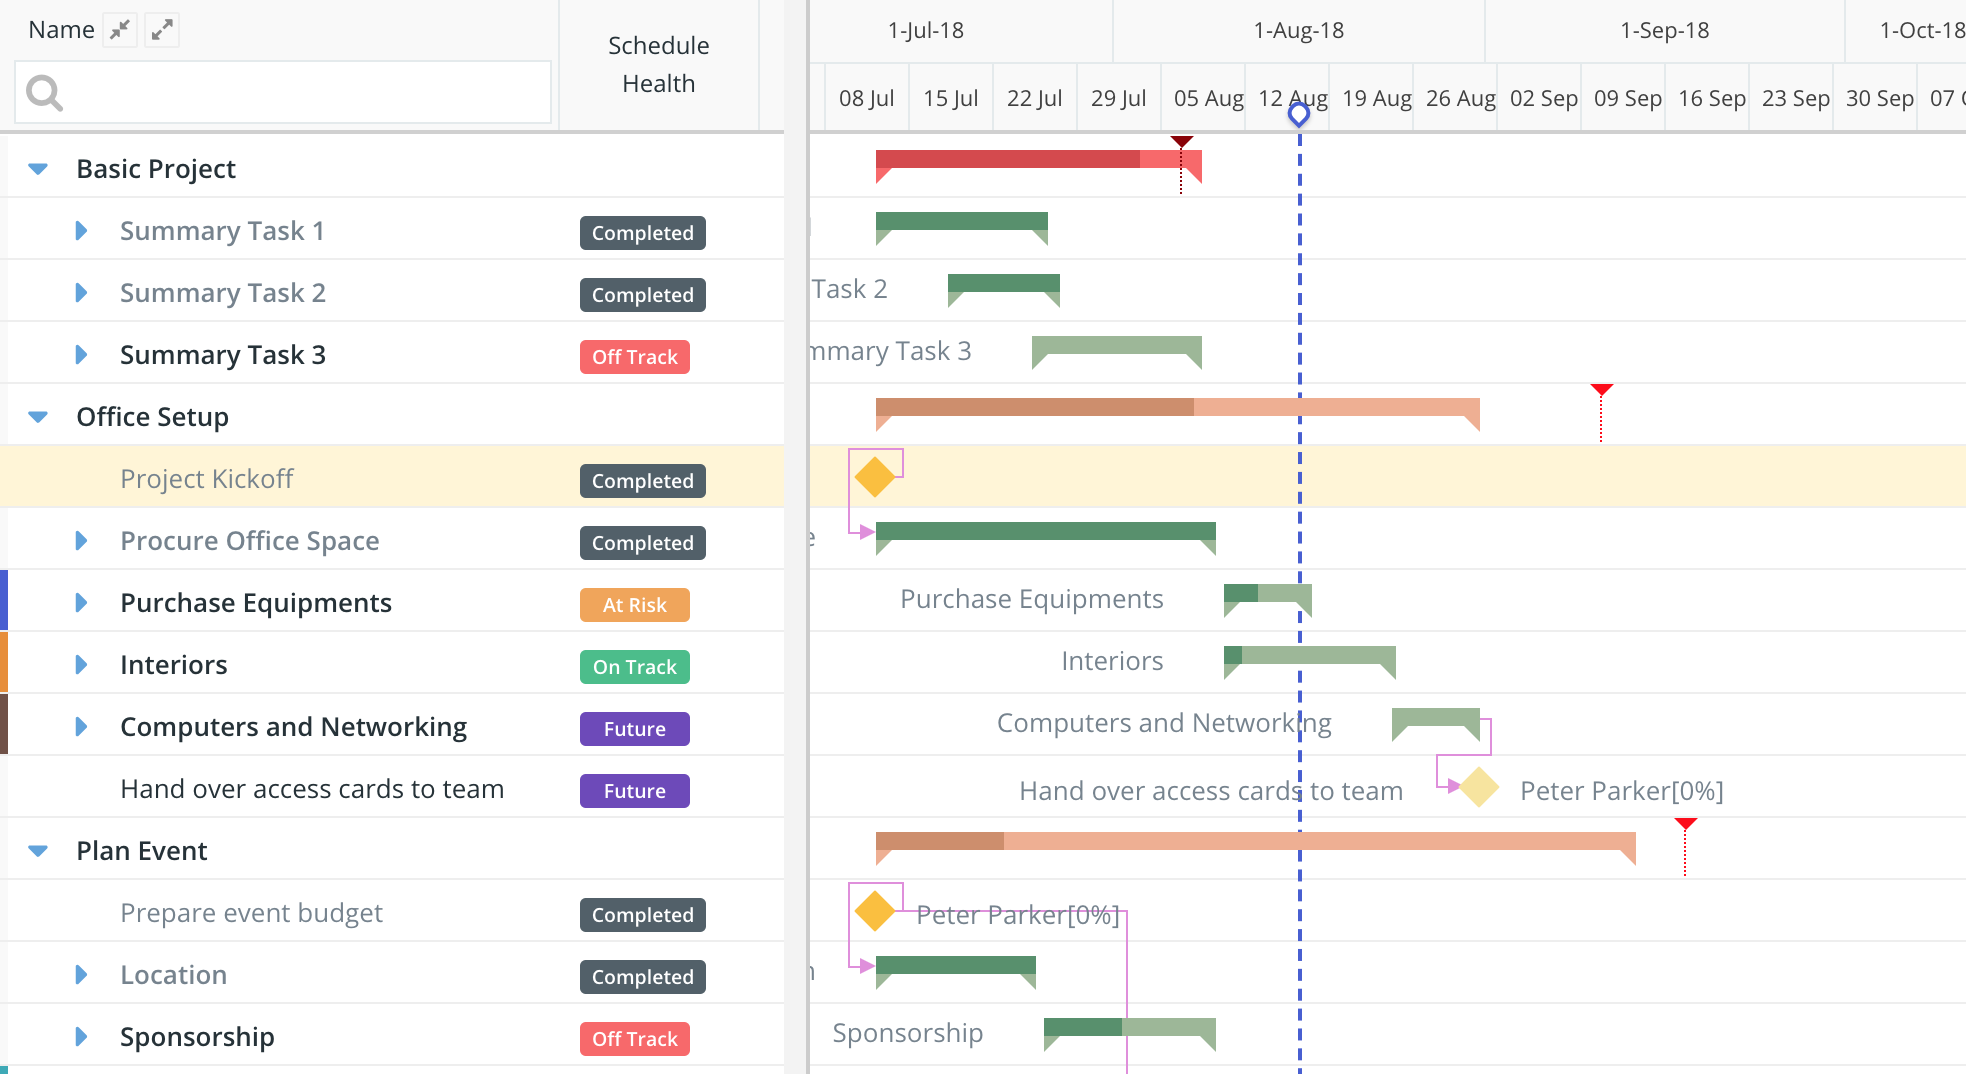
Gantt
The Gantt output is available only for project and task reports. In case of tasks, the output is a cross-project gantt chart as shown below.
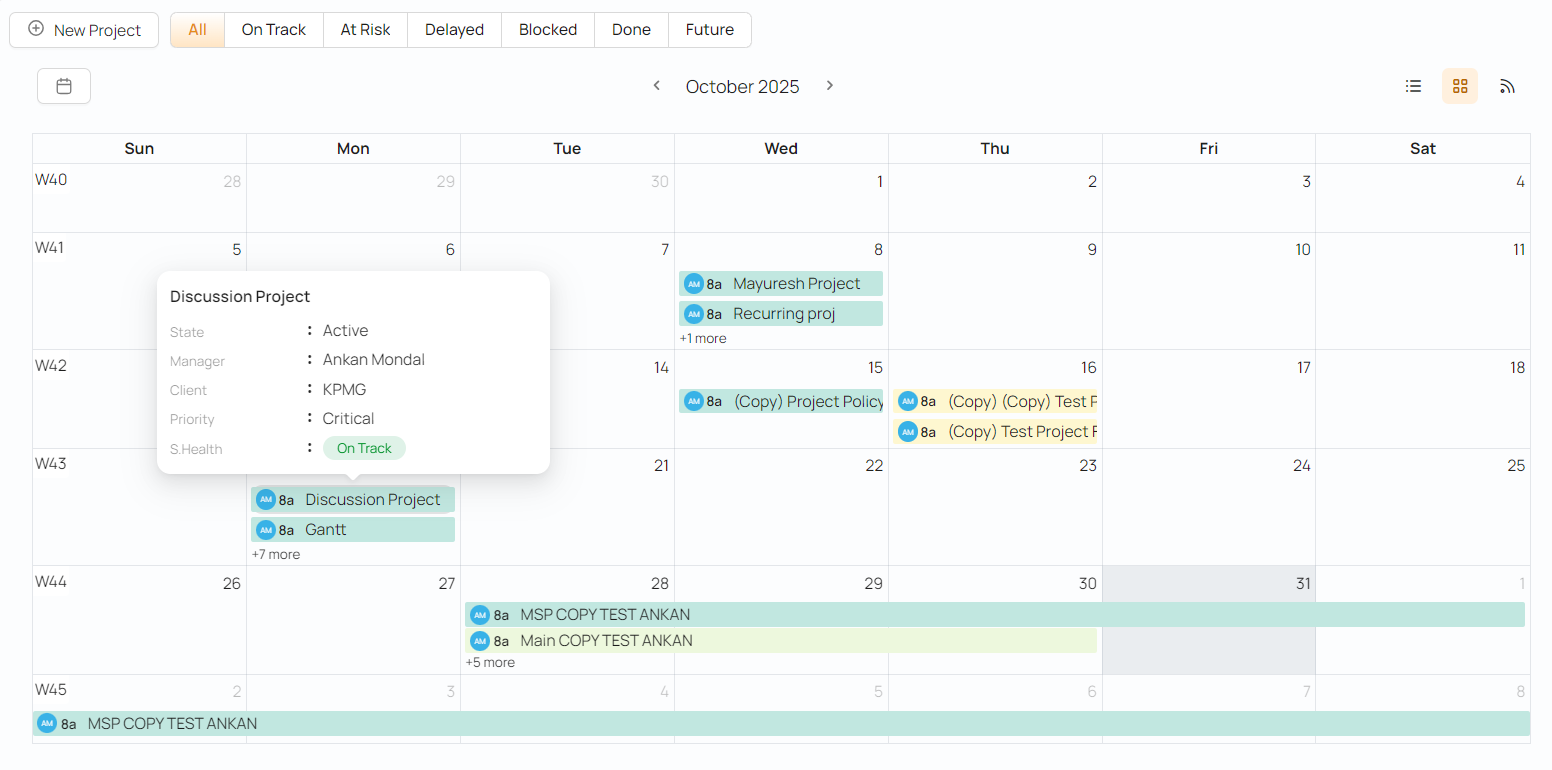
Calendar
The Calendar output generates a calendar view for projects and tasks as shown below. The bar is colored as per the color of the project or task. You also have the option of turning off the bars in which case the start and finish event for the task and project will be separately generated.
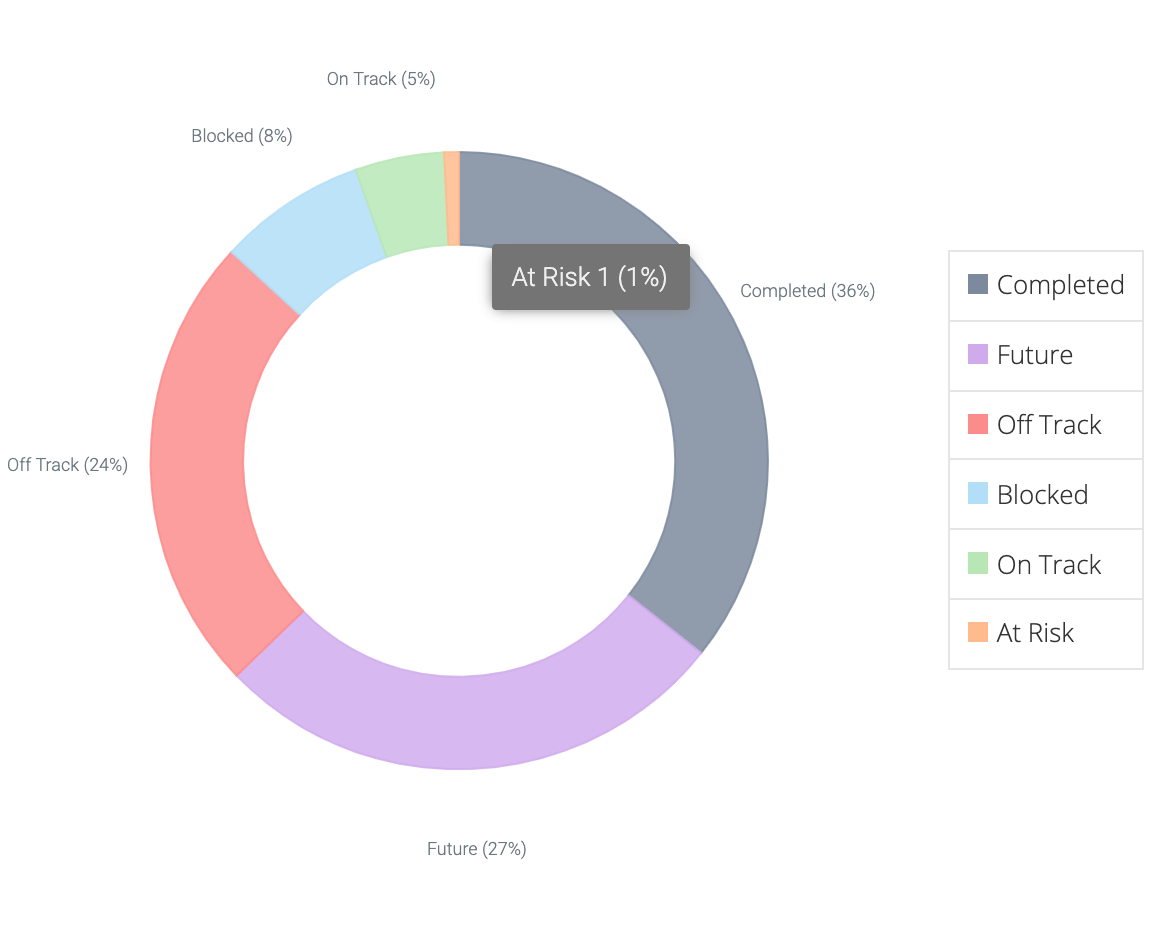
Pie
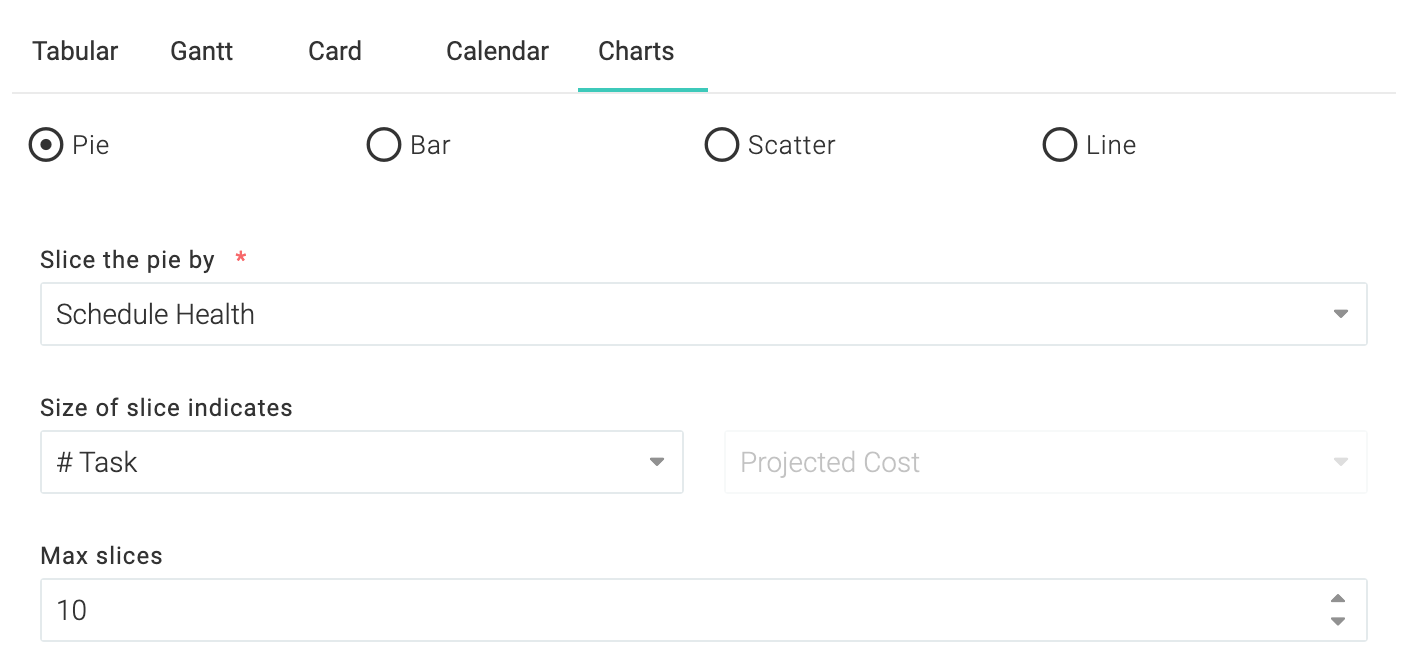
It is easy to create pie charts in Celoxis. These settings were used to create the Pie chart below.
Bar
Celoxis supports a number of popular bar chart formats. Each of the bar chart type has been explained below and the form settings used to generate the chart has also been provided.
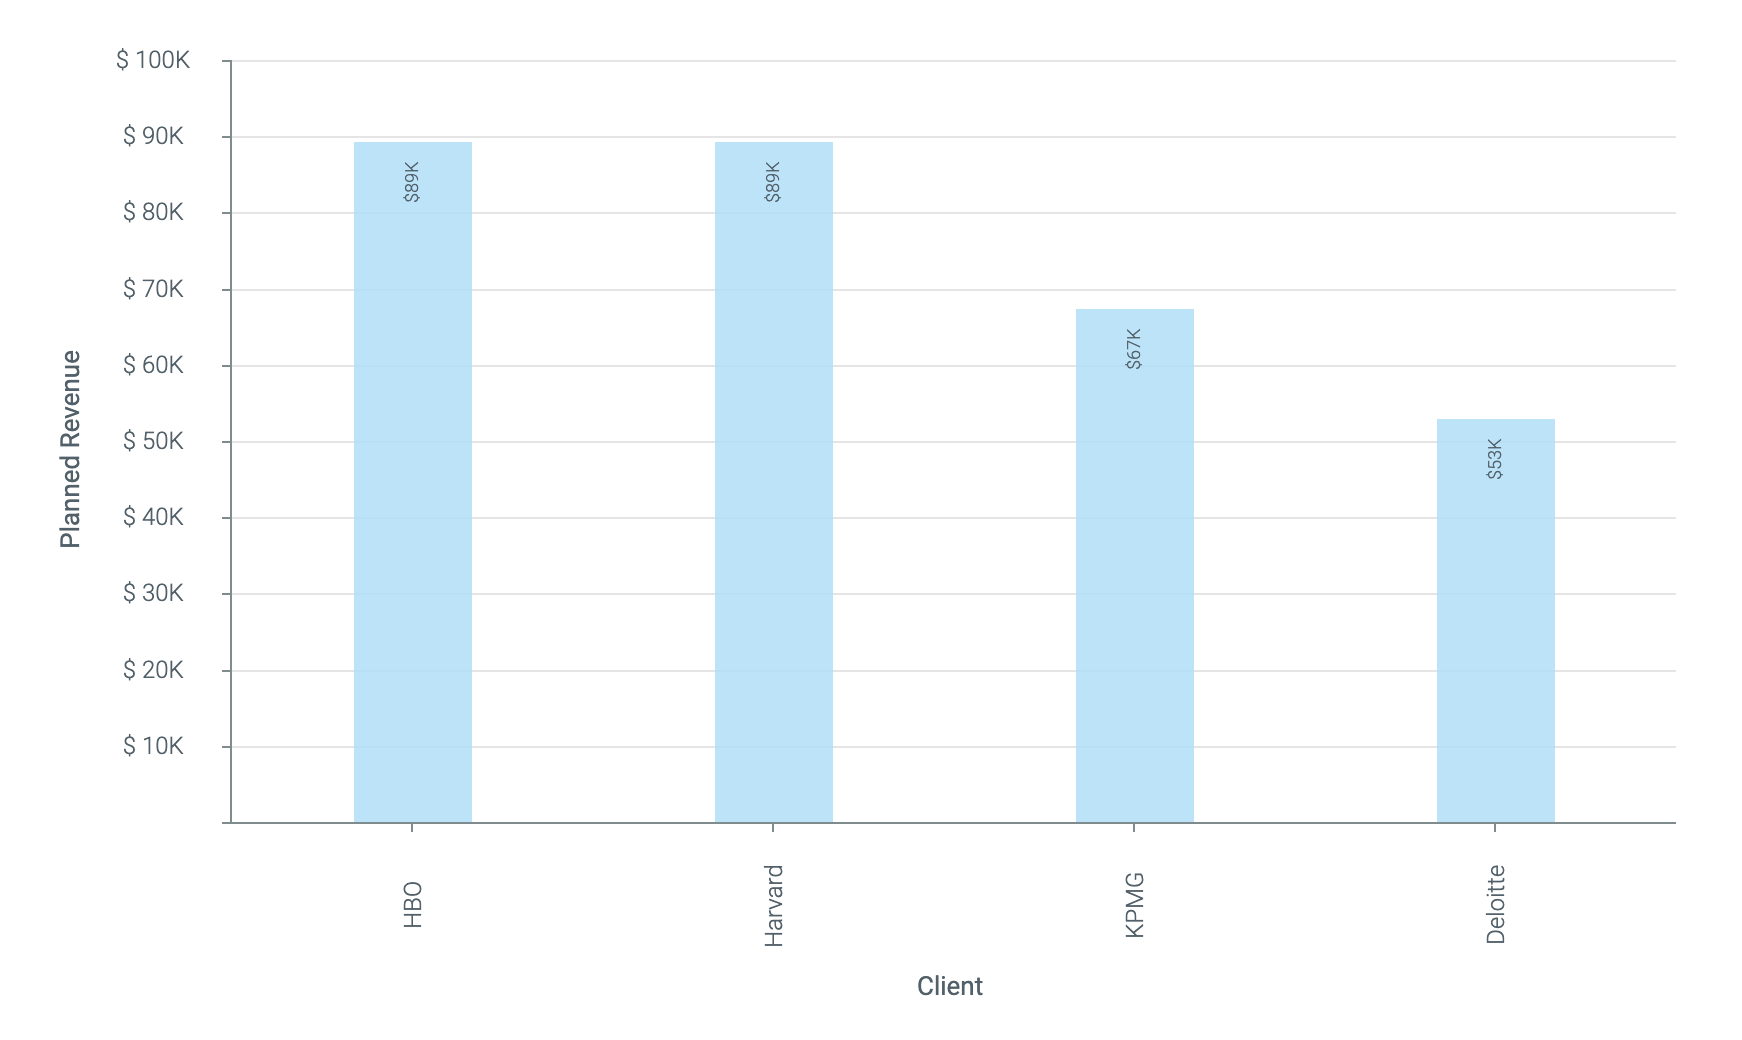
BarChartTypeSingle
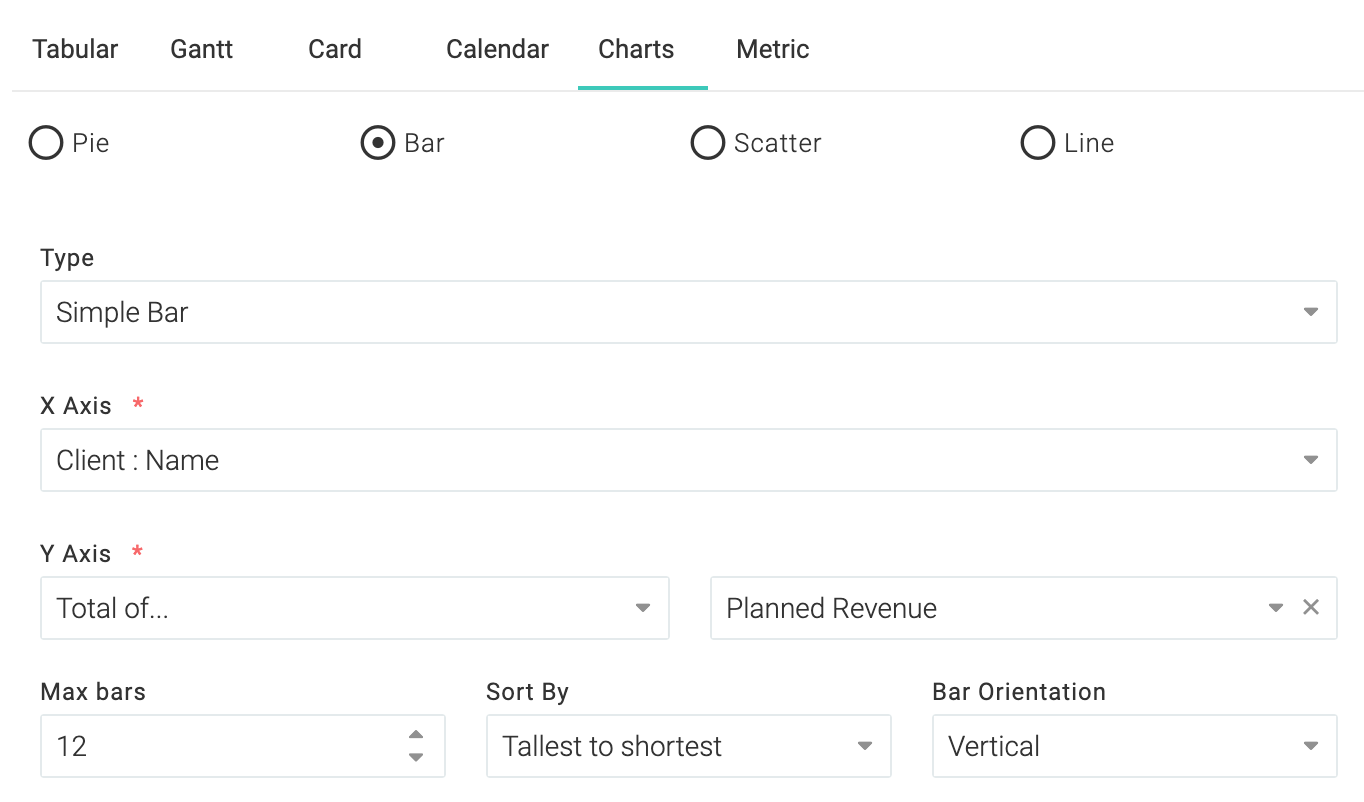
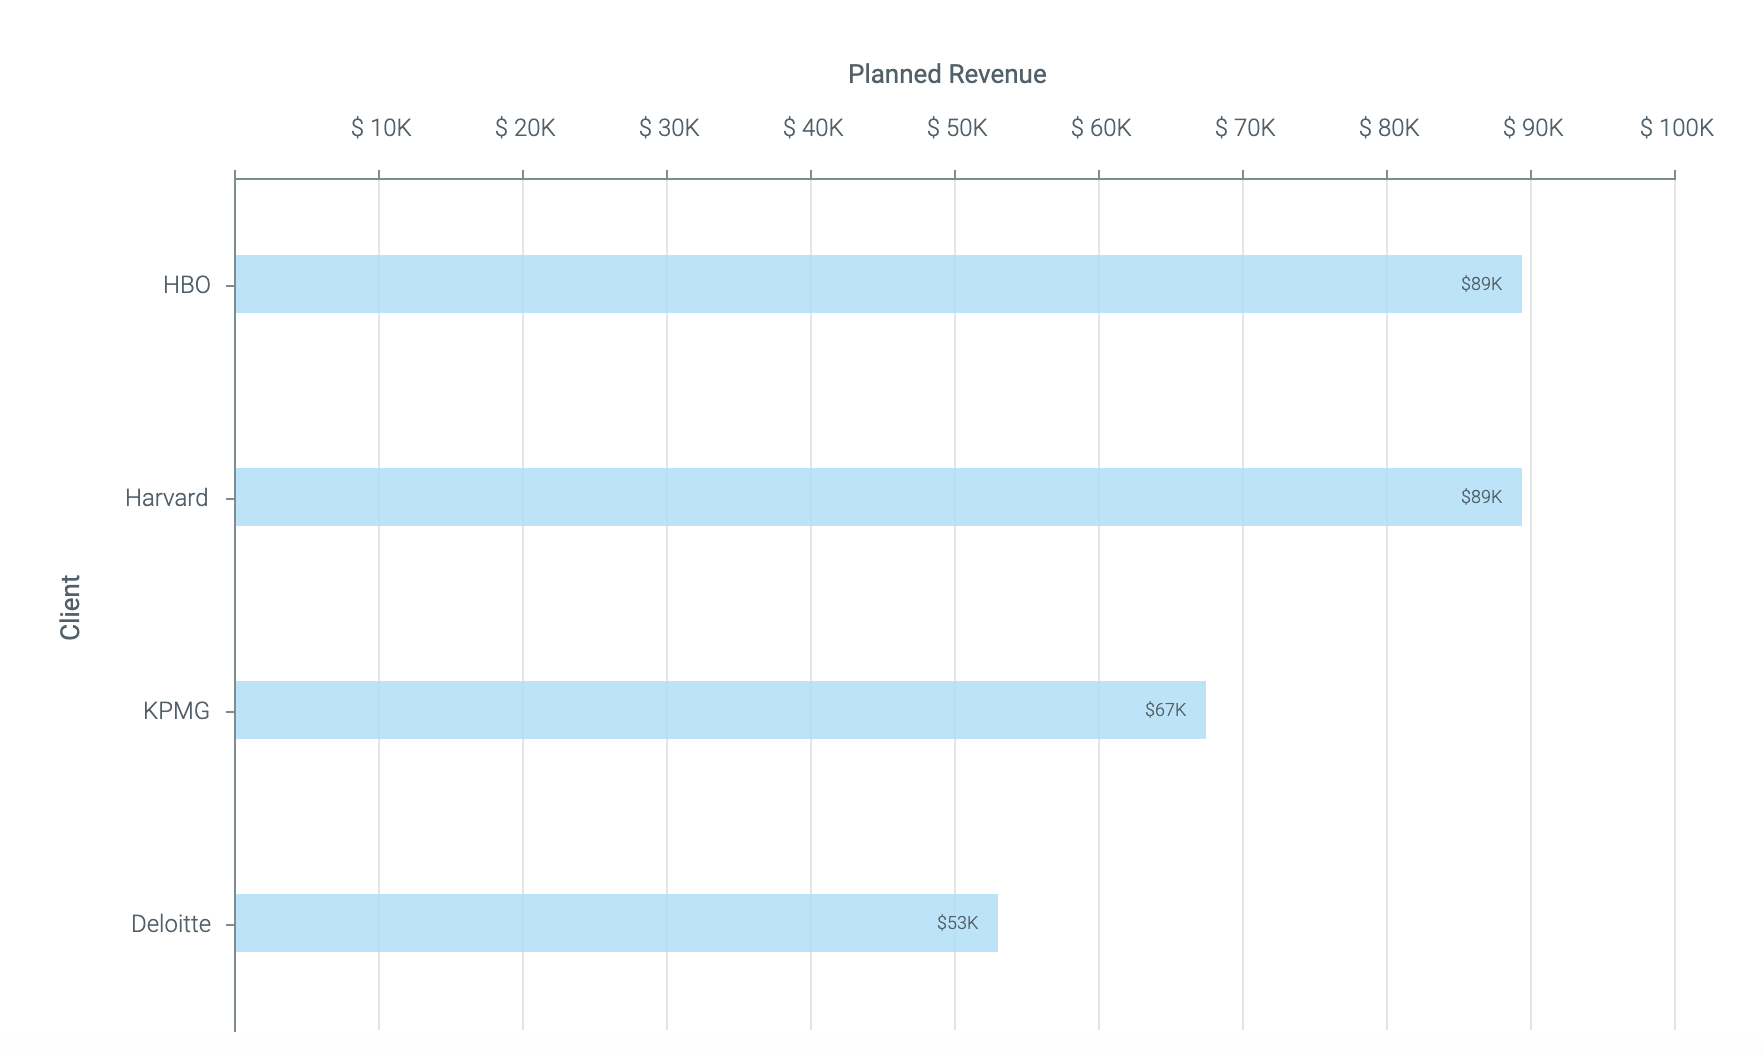
The following bar chart was generated using these settings. Note how the Sort By setting sorts the bars in decreasing order. If you set the Bar Orientation as horizontal, it would result in this chart.
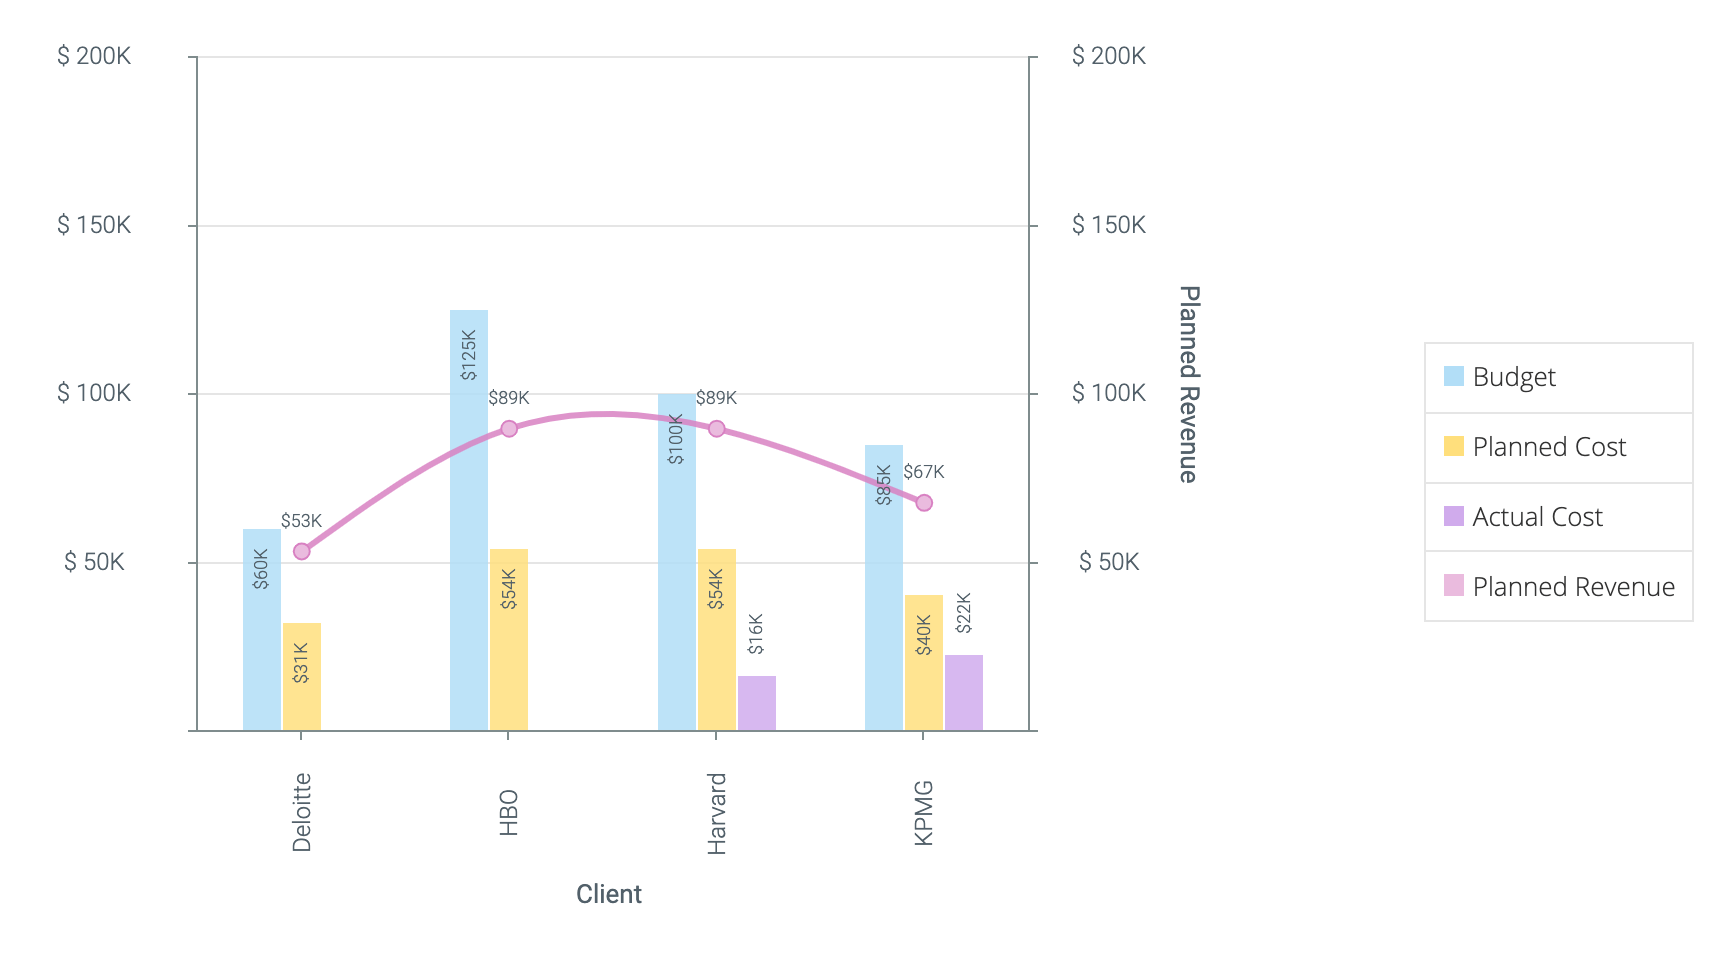
BarChartTypeComparison
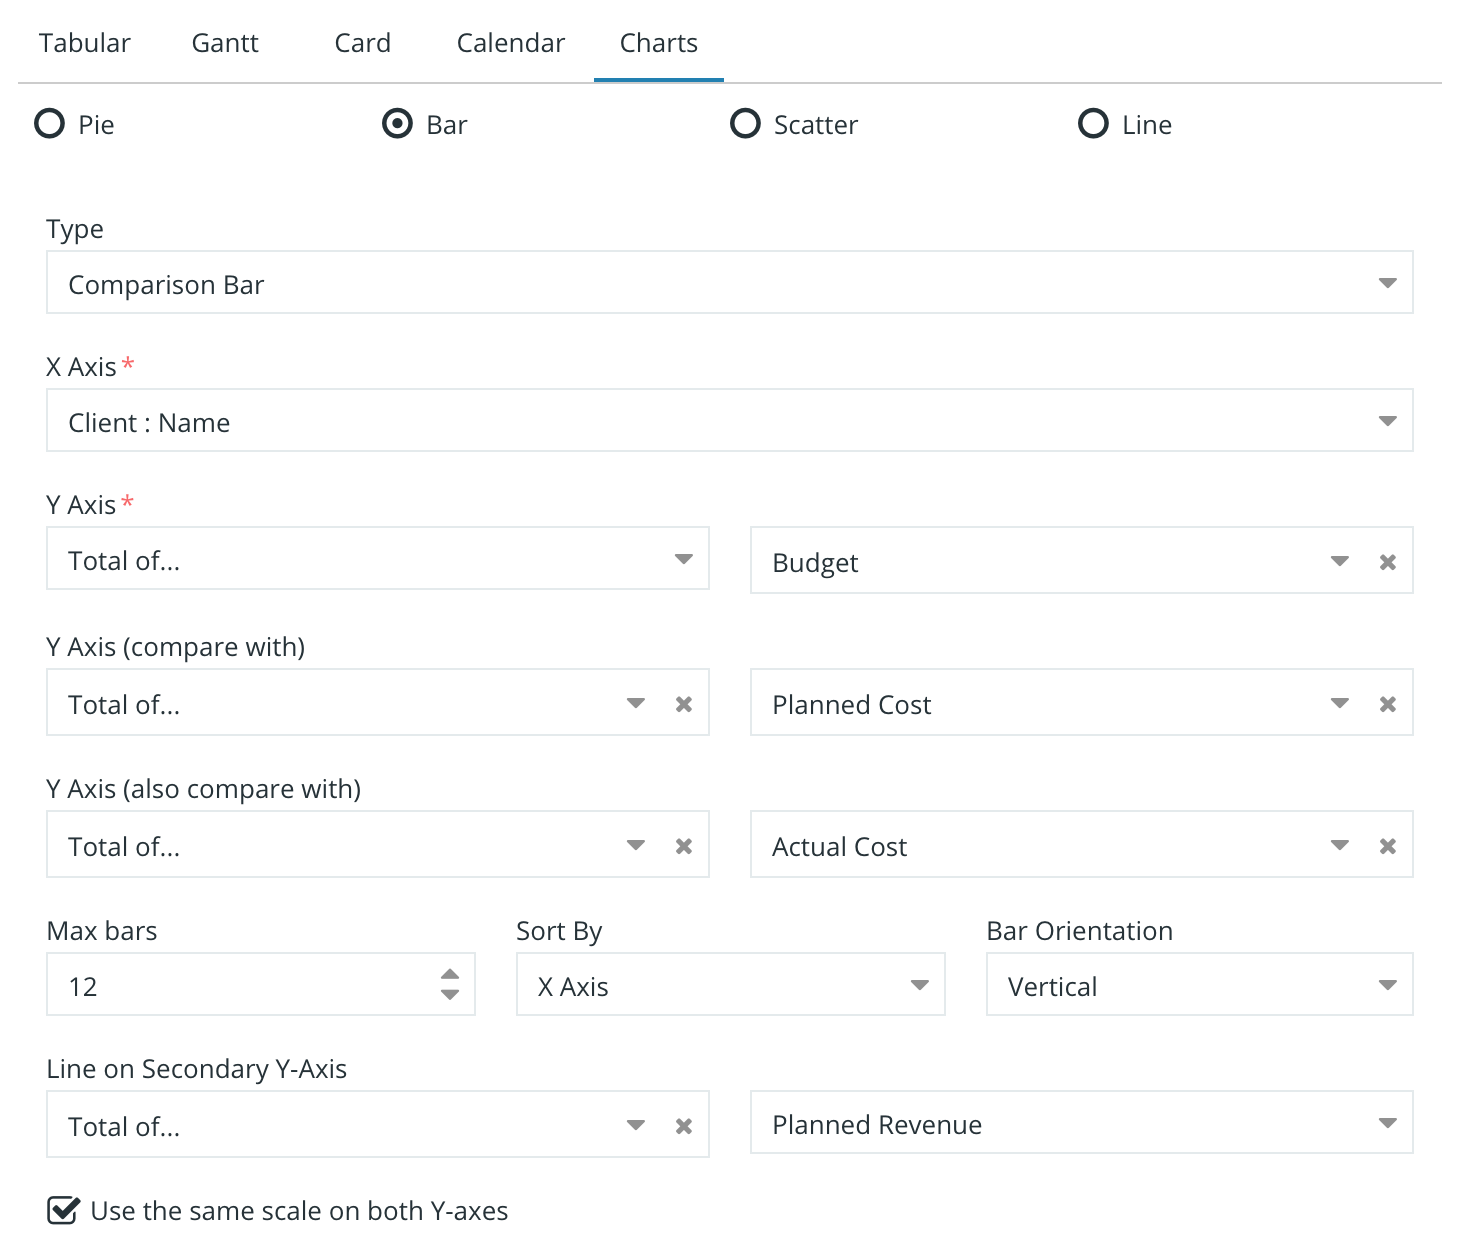
The following comparison bar chart was generated using these settings.
BarChartTypeStacked
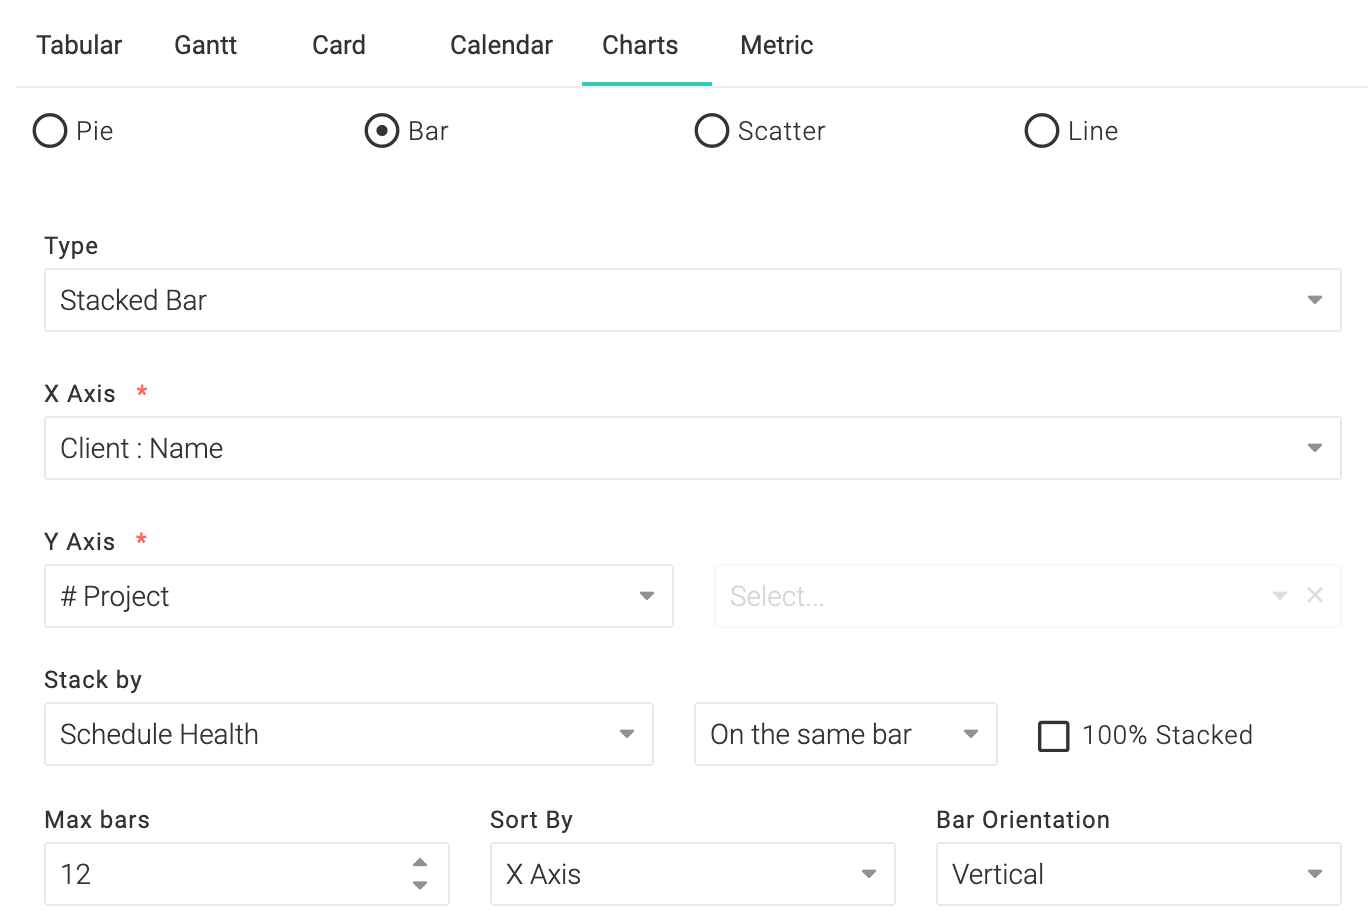
The following stacked bar chart was generated using these settings. Notice how the colors correspond to the color of the health indicator.
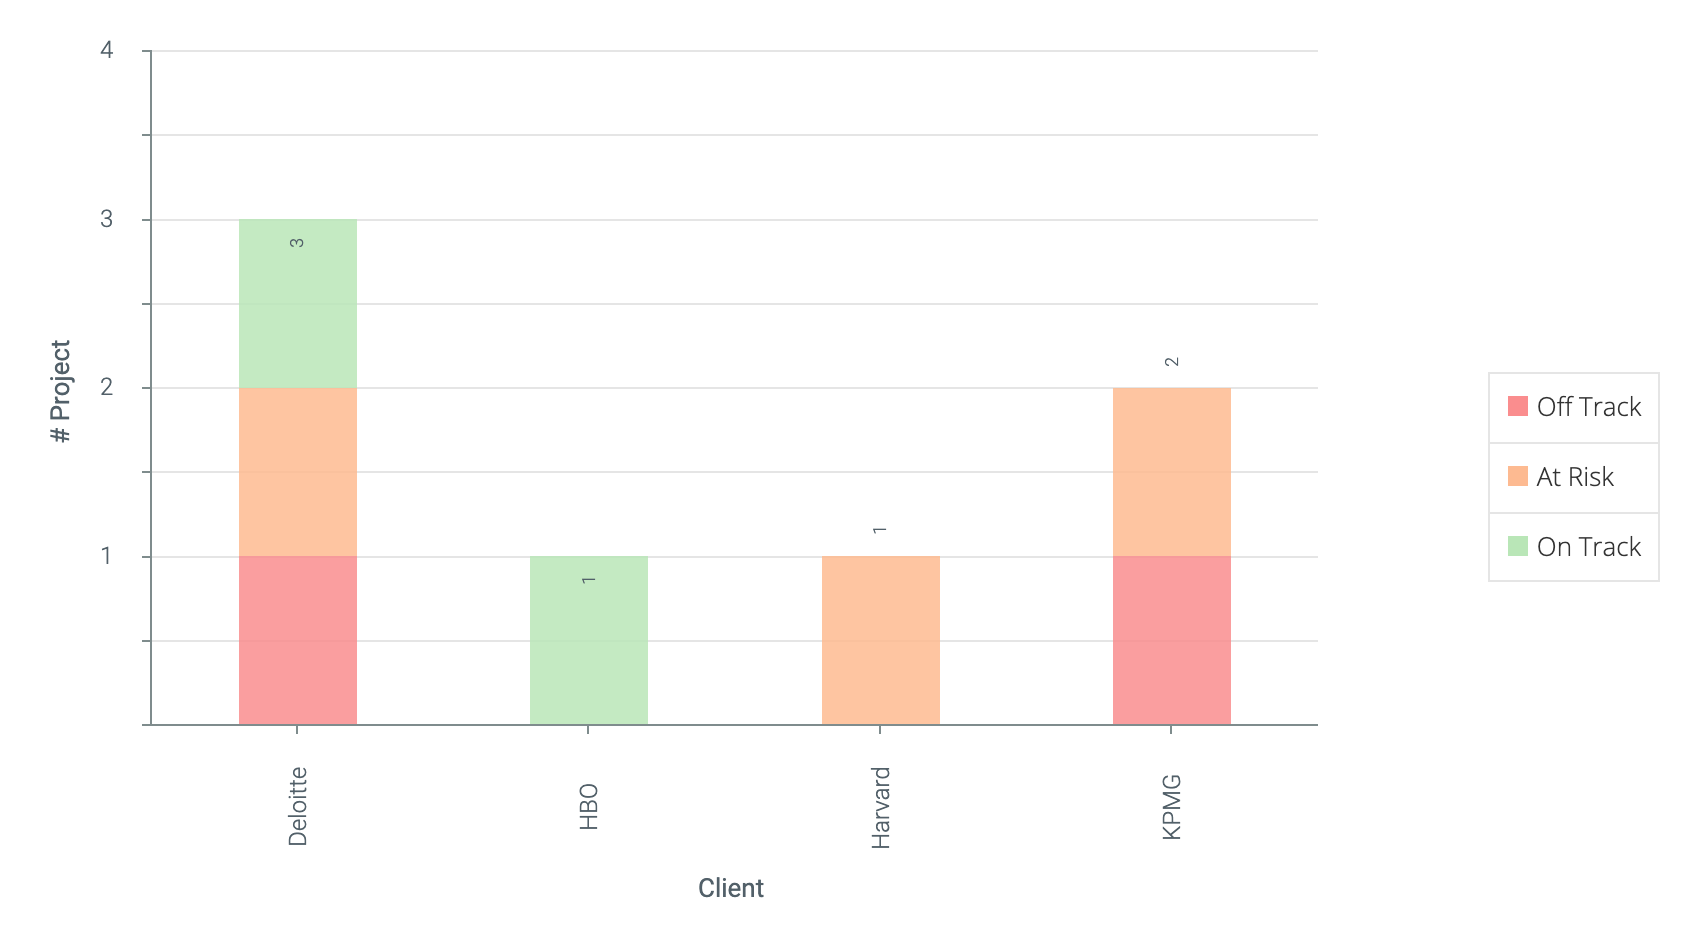
You also have the option of stacking it side-by-side.
Bubble
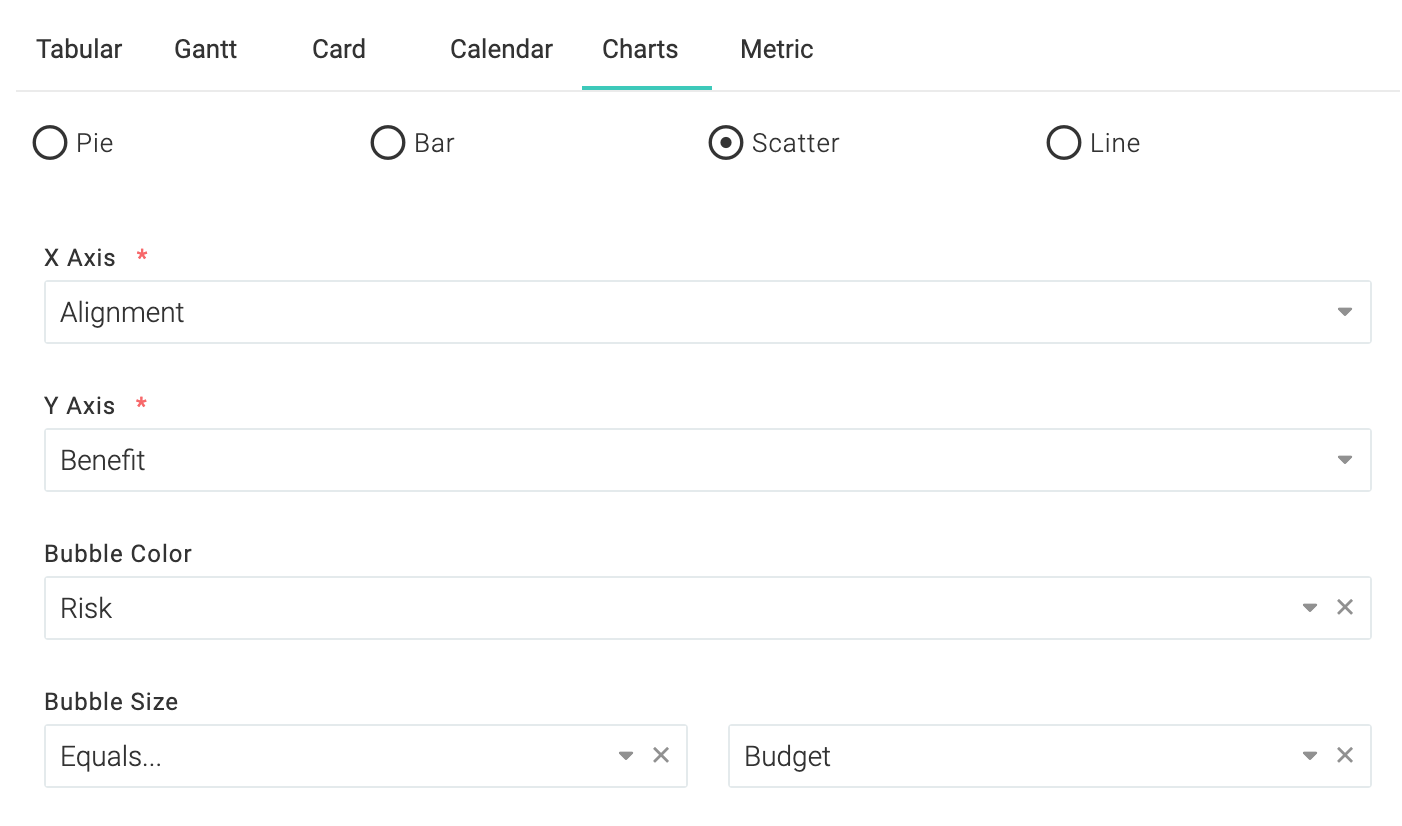
The following bubble chart was generated using these settings.
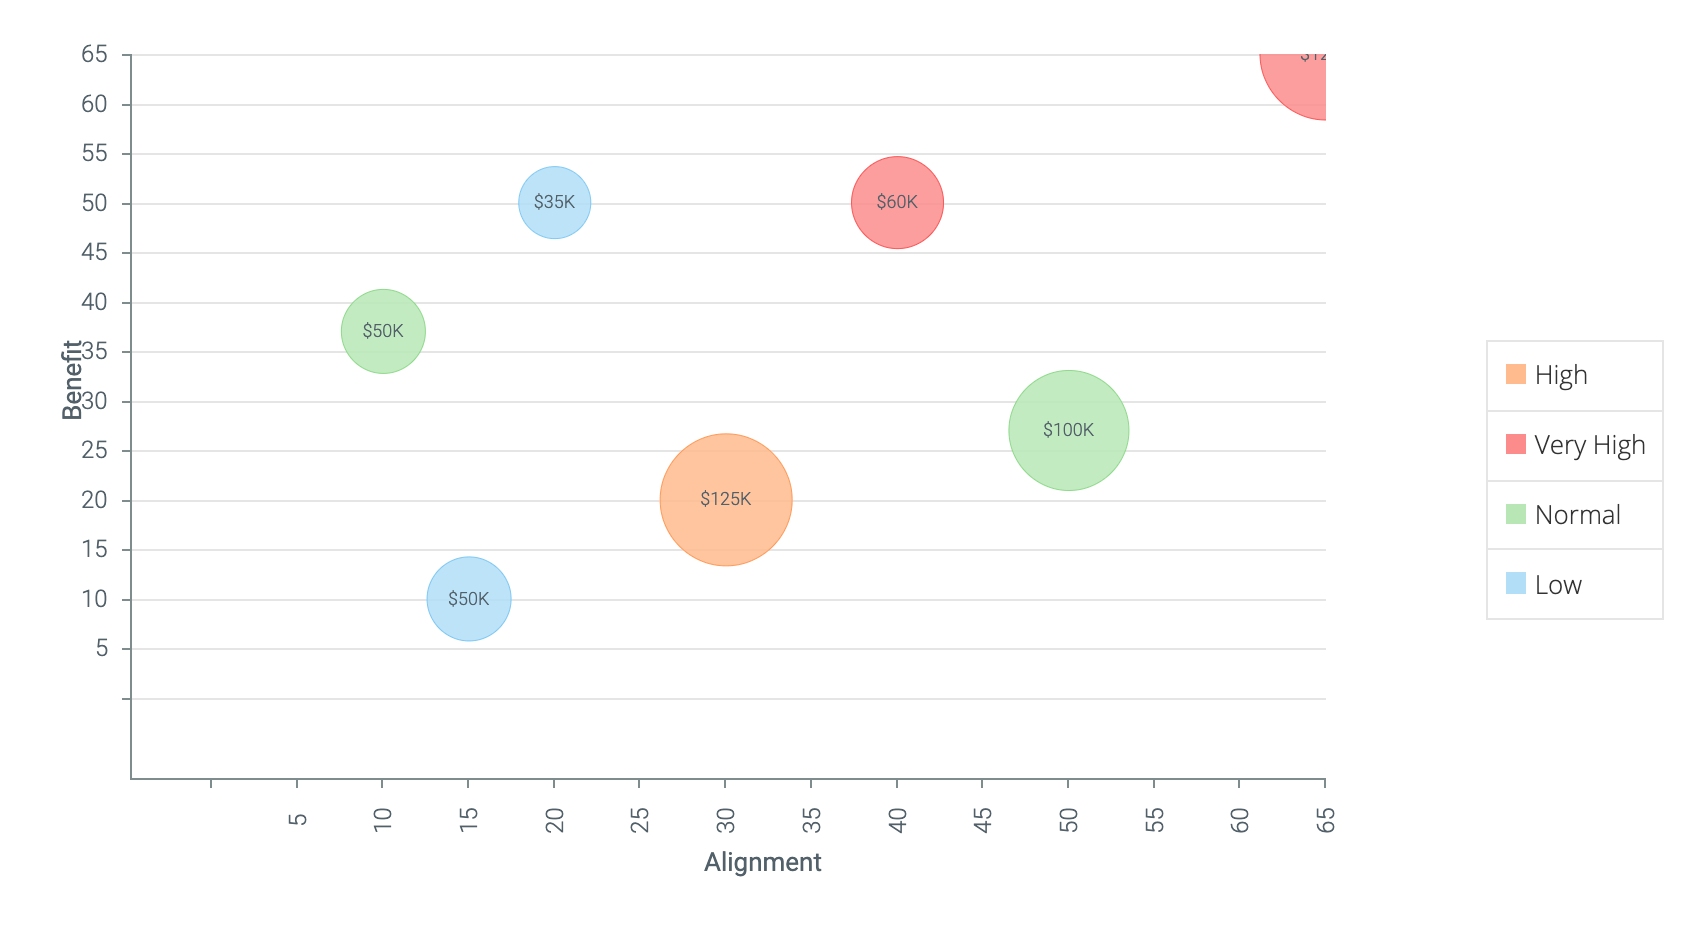
If you do not select the bubble size, then this will become a scatter chart and all bubbles will be of the same size.
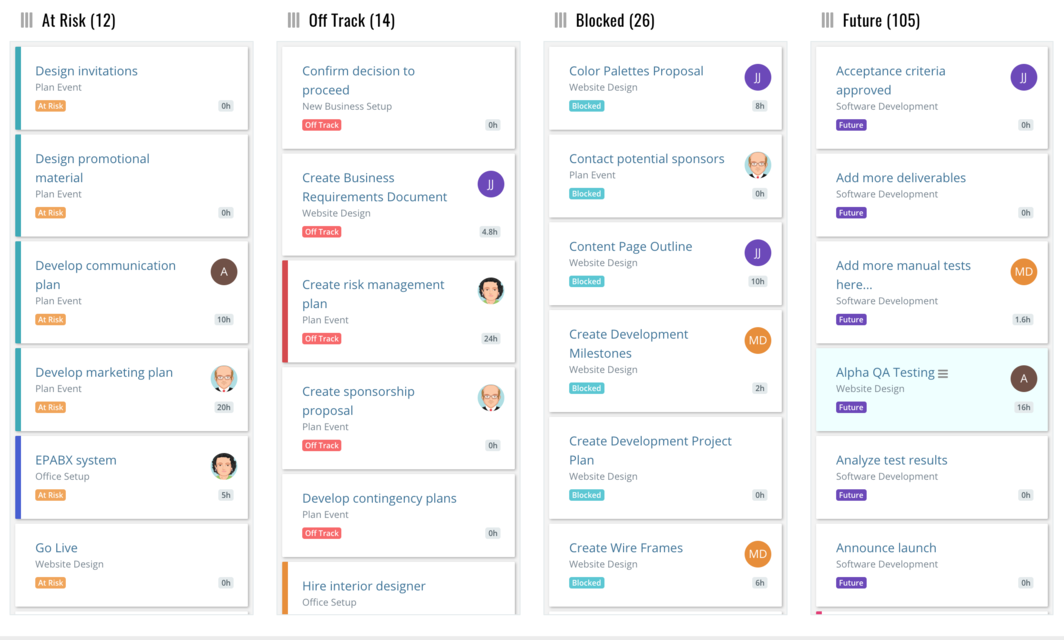
Card
Card view is available as an output type for projects, tasks and apps. You can also drag and drop card across lanes if the lane's attribute is user-editable. For example, you can drag and drop if the lane was a custom field like Kanban State but not if the lane was system calculated field like Schedule Health.
Marking tasks as 100% complete
When a task is dragged to a certain column in the card view it is often desired that it should be automatically marked as 100% complete.
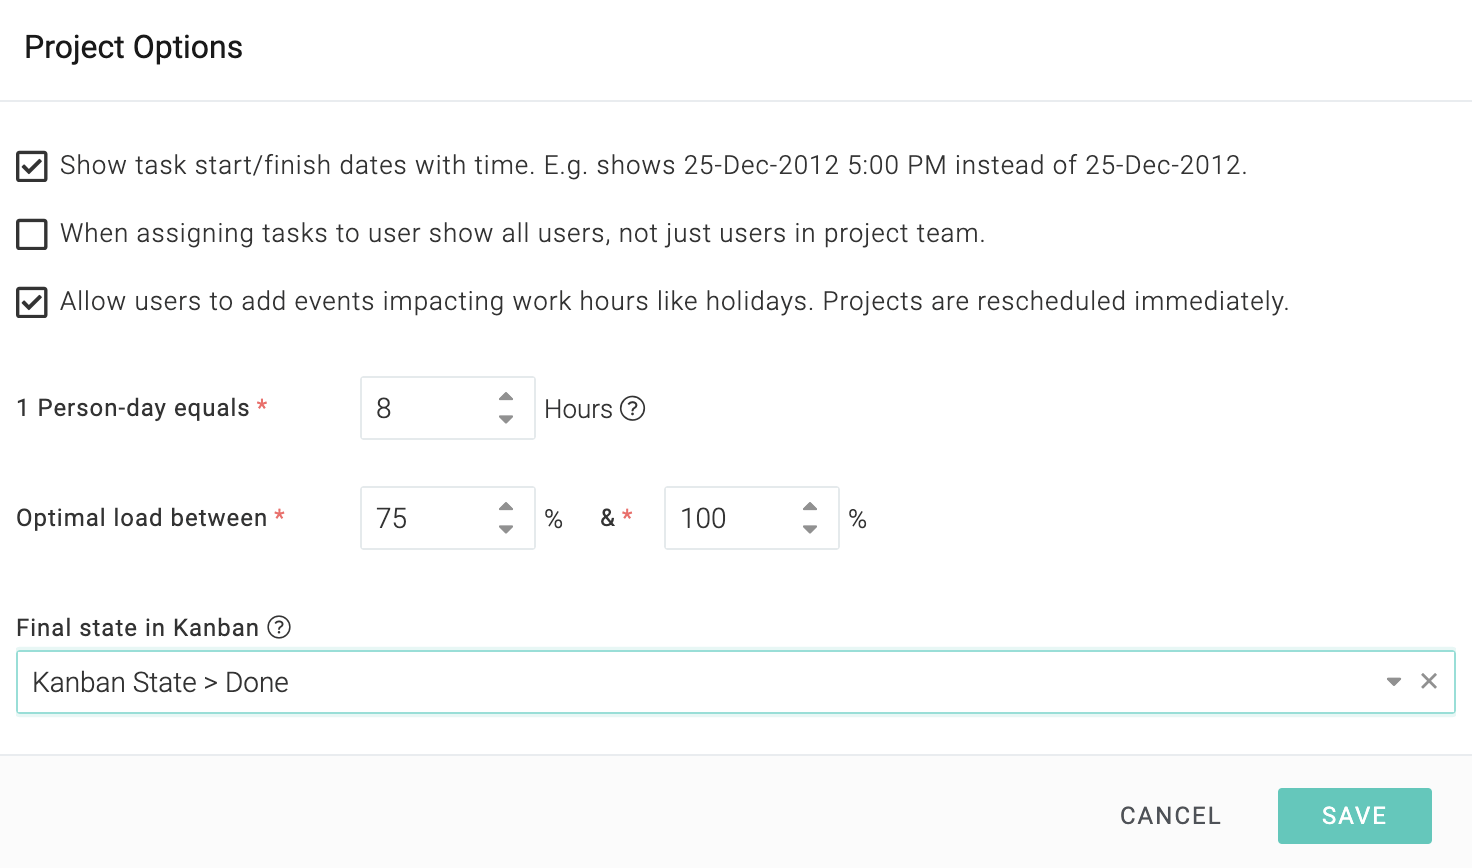
To set this up, log in as a user with administrator privilege and go to Top Menu ▸ ▸ Admin ▸ ProjectManagement ▸ OptionsX/Project. You should see a field called Final State in Kanban. Select the column in which you want the task to be marked as 100% complete and save.
In the following example, we have selected Kanban State > Done. You can select any other custom field that you use for your card view. This means that when the Kanban State custom field of a task is set to Done, the task will automatically be marked as 100% complete. This can be achieved by the end-user either by drag-n-drop in the card view or by editing the task and setting the Kanban State field to Done.
Naturally, if a task is marked 100% complete, its Kanban State will be automatically set to Done.
Also, if the custom field of a completed task is modified to anything other than Done, its percent complete will be reverted to the previous value. Similarly, if the percent complete of a completed task is set to anything other than 100%, its Kanban State field will be set to the previous value.