Report Types
There are many entities in Celoxis like projects, tasks and time logs. Some entities are also created by you using custom apps like bugs, risks, and issues. Each entity has its own attributes as well as attributes aggregated from other entities contained in it. For example, the project entity has its own attributes like name, priority, manager as well as attributes approved hours, invoiced revenue, planned labor cost, actual labor cost, etc. that are calculated from other entities like tasks, time logs and expenses.
When you create a report on Celoxis you have to first pick an entity on which to report. You can choose from:
| Type | What you get |
|---|---|
| Project | Project attributes including data aggregated at the project level from timesheets, expenses and tasks like hours, cost, revenue, profit, margin, etc. |
| Task | Task attributes including data aggregated at the task level from timesheets and expenses like hours, costs, revenue, etc. |
| Time Entry | Time entry attributes like hours, submitter, cost, bill amount, etc. You can use these individual time entries to aggregate data the way you want. For example, using this report, you can understand how time was distributed across activities per client. |
| Expense | Expense line item data like amount, expense code, etc. You can use these individual expense line items to analyze your non-labor spends in a flexible way. For example, you can understand how expenses are distributed by expense codes per client. |
| File | File information like check-outs, total size, path, etc. |
| Discussion | Discussion information. E.g. you can create a report that lists all active discussions where you are participating. |
| Apps (e.g. Bug) | App information or data aggregated for each workflow instance from timesheets like hours, costs, etc. |
| Task Status Update | Progress update attributes of your tasks. For example, you can report on all the updates made in this week. |
| Assignment | Task assignment information like task, resource, planned vs actual hours, etc. An assignment refers to the allocation of one resource to one task. |
| User | User attributes. Read More. |
| Dashboard | A dashboard report. Read More. |
| Activity Log | Activities happening on different entities - who did what and when. Read More. |
| Trend | Time phased data of hours, cost, revenue, utilization, etc. Time phased data is the distribution of data in time. You can read more about it later in this chapter. |
Trend
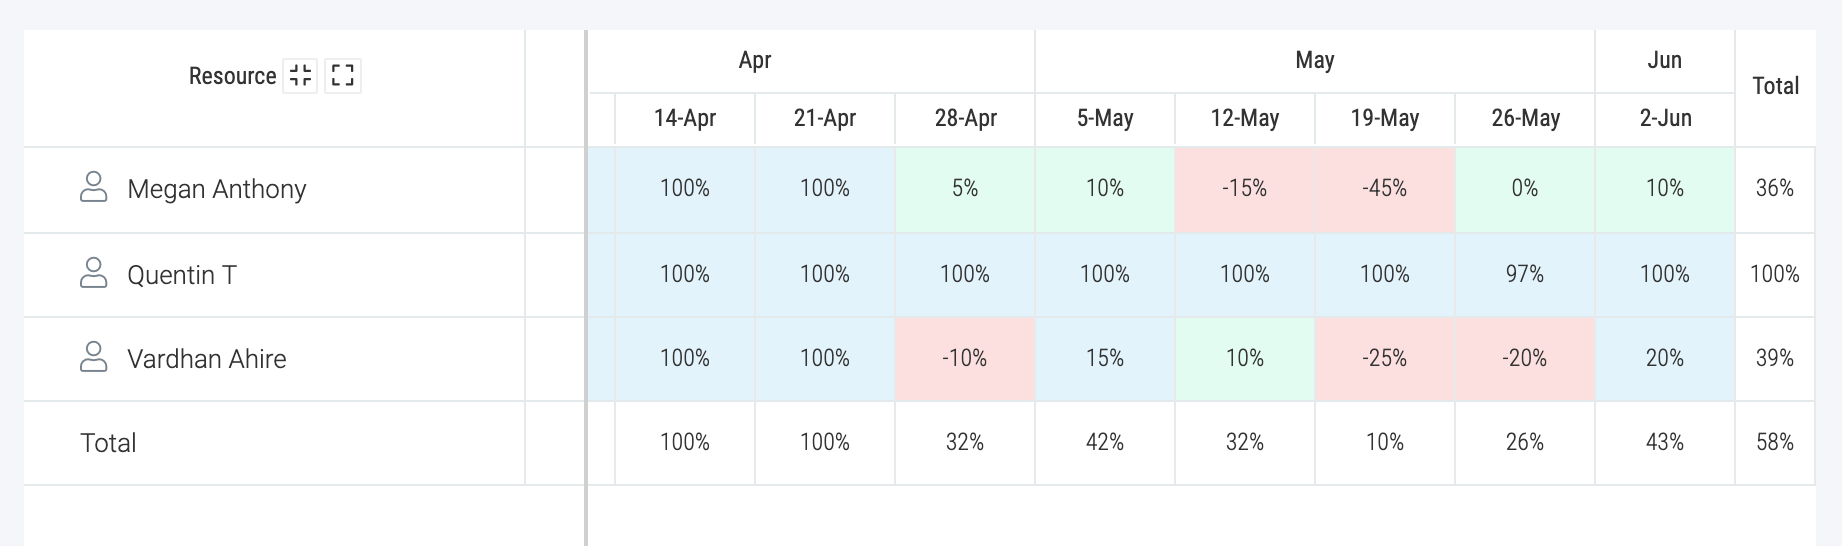
Time phased reports show how a quantity is distributed over time. For example, when you run a project report, you can see the total estimated cost of the project but if you want to understand the planned spend per week or month, then you will need to run a time phased report. Many quantities have time phased nature. E.g. budget, effort, cost, and revenue.
You can view time phased data in a tabular format as shown below or in the form of charts. Currently, unlike other entities, charts are not drill-down capable.
| Available Hours | The working hours of a resource depending on the work calendar timings and exceptions. |
| Actual Capacity | 1 - (Actual Effort ÷ Available Hours) as a percentage |
| Actual Effort | Approved hours in time logs |
| Actual Utilization | Actual Effort ÷ Available Hours as a percentage |
| Planned Capacity | 1 - (Planned Effort ÷ Available Hours) as a percentage |
| Planned Effort | The number of hours a resource is allocated on a task |
| Planned Utilization | Planned Effort ÷ Available Hours as a percentage |
| Actual Non-billable Hours | Approved non-billable hours from time logs |
| Efficiency | Resource efficiency is calculated as Planned Effort ÷ Actual Effort as a percentage. A value of 100% means the resource is performing exactly as expected. Less than 100% means worse than expected while more than 100% means better than expected. |
| Free Hours | The number of unallocated time for a resource i.e. Available Hours - Planned Effort. |
| Free Hours (Realtime) | Shows free hours assuming remaining hours for a task is distributed as per allocation from the present date. Remaining hours for a resource is Planned Effort - Actual Effort |
| Invoiced Hours | Hours from invoiced time logs. |
| Actual Billable Hours | Hours from approved time logs marked as billable |
| Actual Cost | Total of labor, expense and fixed cost. |
| Actual Labor Cost | Sum of cost from time logs |
| Actual Margin | Actual Profit ÷ Actual Revenue |
| Actual Profit | Actual Revenue - Actual Cost |
| Actual Revenue | Sum of bill amounts of approved time logs and expenses |
| Invoiced Revenue | Sum of bill amounts of invoiced time logs and expenses |
| Planned Cost | Sum of planned labor cost, planned non-labor cost and fixed cost |
| Planned Labor Cost | The estimated cost of a resource working on a task. Total amount is distributed uniformly over the task duration. |
| Planned Margin | Planned Profit ÷ Planned Revenue |
| Planned Profit | Planned Revenue - Planned Cost |
| Planned Revenue | Planned Effort × Resource Bill Rate. Available only when company's billing model is user-based not activity-based. |
| Revenue Potential | Available Hours × Bill Rate. Available only when company's billing model is user-based not activity-based. |
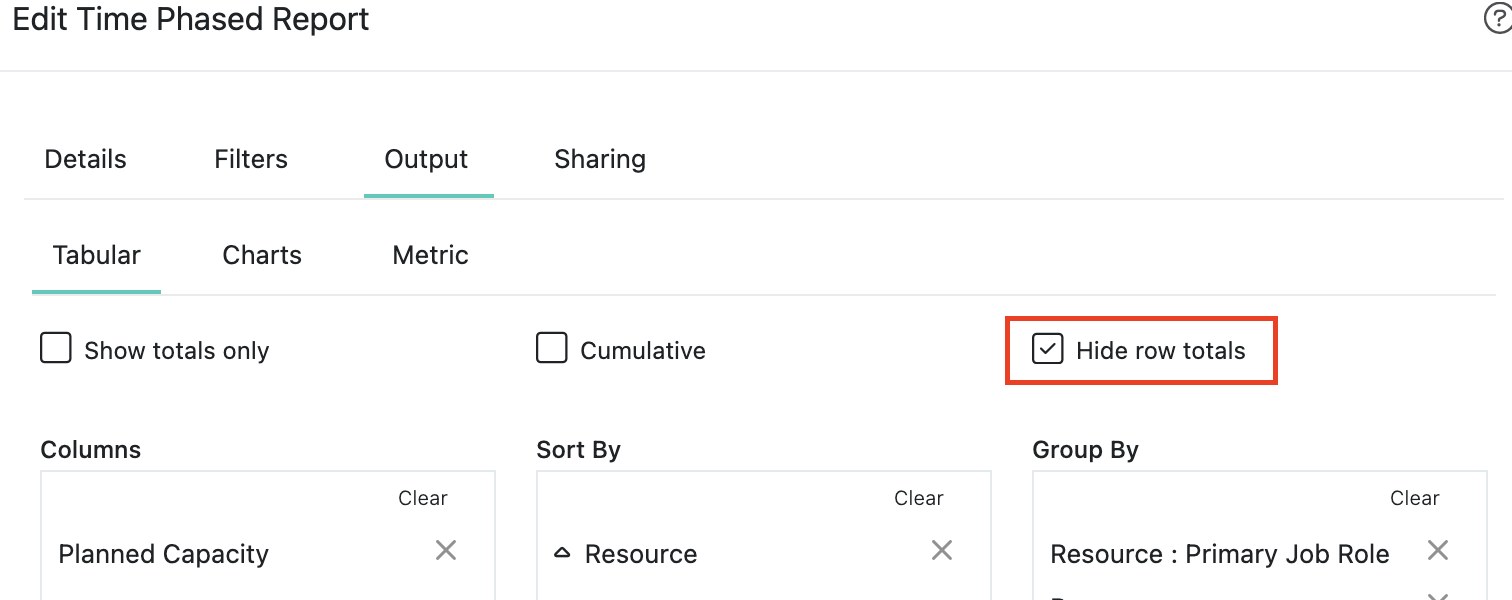
Hide Total Columns
This option will hide the total columns from time-phased reports to help you easily focus on specific data.