
This isn’t a hypothetical. For most PMO leaders, it’s Tuesday.
Resource forecasting in a multi-project environment is where the best-laid portfolio plans come apart — not because teams lack talent, but because demand is invisible until it’s already overdue. According to PMI’s Pulse of the Profession, 11.4% of every dollar invested in projects is wasted due to poor project performance, much of which traces back to resource misalignment. Gartner research further shows that organizations with mature resource management practices complete 50% more projects on time than those without.
This post is for PMO leaders who are done with spreadsheets, done with reactive firefighting, and ready to build a resource forecasting discipline that actually holds across a shifting project portfolio.
Stop Finding Resource Conflicts After They Become Delivery Risks
Celoxis gives PMOs real-time visibility into capacity, utilization, and resource demand across every project in the portfolio.
See How Celoxis Helps PMOs Transform Operations
Watch this Celoxis customer story to see how PMO software helps teams improve project visibility, resource control, and portfolio execution.

Video: Celoxis PMO software customer success story for project visibility and operational transformation.
Why Resource Forecasting Breaks Down in Multi-Project Environments
Single-project resource planning is manageable. You know your scope, your team, your timeline. Multi-project environments are a different animal entirely.
Here’s what typically goes wrong:
- Siloed planning: Each project manager optimizes for their own project, with no visibility into what their “shared” resources are already committed to elsewhere.
- Demand-supply lag: By the time resource conflicts surface — usually during status meetings — it’s too late to rebalance without blowing a deadline.
- Static forecasts: Plans are built once, usually at project kick-off, and never updated to reflect reality. When scope shifts or timelines slip, resource models become fiction.
- Invisible soft commitments: Pre-sales, internal initiatives, and support work quietly consume 20–30% of available capacity that never appears in any project plan.
The result is a portfolio that looks green on paper until it suddenly doesn’t — and a PMO that spends more time explaining delays than preventing them.
The real problem isn’t a lack of resources. It’s a lack of resource visibility.
The Core Components of Effective Resource Forecasting
Before jumping to tools or tactics, it helps to agree on what resource forecasting actually means in a multi-project context. There are four foundational components every PMO needs to get right.
Demand Forecasting
Translating your project pipeline into specific resource requirements — by role, skill, hours, and timeframe — before work begins. This means connecting portfolio intake to workforce planning, not treating them as separate exercises.
Supply Mapping
Understanding actual availability: who is on the bench, who is allocated, who is on leave, and who has hidden commitments outside the formal project portfolio. Supply mapping fails when it relies on self-reported data or stale org charts.
Capacity Analysis
The gap calculation between demand and supply, performed at the portfolio level. Good capacity analysis should answer: If we approve these five projects, which roles become the bottleneck, and when?
Continuous Reforecasting
Treating the resource plan as a living document. Projects shift. Scope creeps. People leave. A forecast that isn’t updated weekly is a liability, not an asset.
Capacity Planning: Matching Supply to Demand Before It’s Too Late
Capacity planning is where PMOs earn their credibility with the C-suite. Get it right, and you become the function that prevents expensive surprises. Get it wrong, and you’re the function that explains them.
Understanding the Numbers That Matter
The data below reflects a common pattern in mid-size enterprises managing 15–30 concurrent projects:
Three of five key roles are operating at or above capacity. Without forecasting, this doesn’t surface until sprint planning — when it’s already a crisis.
Skill-Based Allocation vs. Role-Based Allocation
Most PMOs still allocate by job title. A better approach is skill-based allocation — mapping work to specific competencies, not just org chart positions. This matters when:
- You have two people with the same title but very different skill sets (e.g., one Java developer who also knows ML, one who doesn’t).
- A project requires a niche capability that only two people in the organization hold.
- You’re planning a phase six months out, where current role structures may have changed.
Skill-based allocation requires a maintained skills registry, which is overhead — but it pays off when you’re trying to staff a new cloud migration without losing your existing delivery commitments.
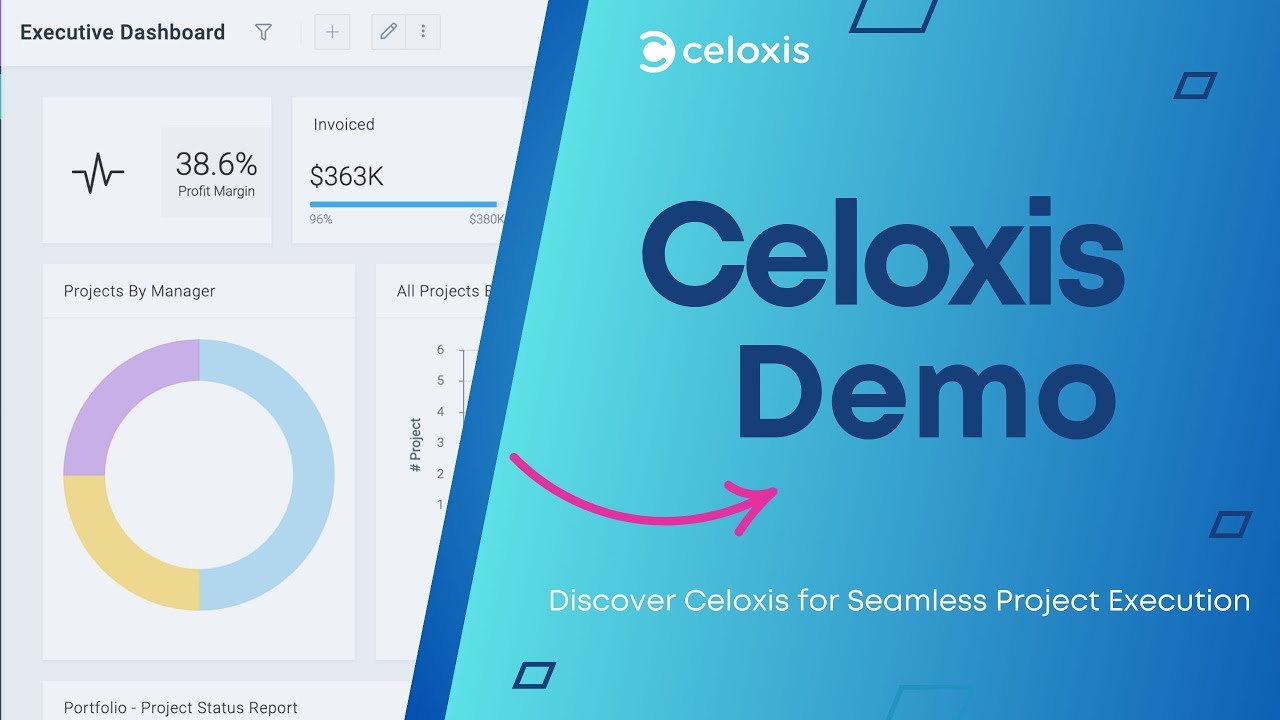
See Capacity, Demand, and Delivery Risk in One Place

A centralized reporting dashboard helps PMOs move from manual status collection to real-time portfolio visibility.
How Celoxis Makes Resource Forecasting Workable at Scale
The honest challenge with the practices above is that they require data — clean, current, centralized data — that most PMOs simply don’t have in spreadsheets or disconnected tools.
This is where Celoxis addresses the problem practically. Designed for PMO environments managing multiple concurrent projects, Celoxis provides a unified resource management layer that sits across your entire portfolio — not just individual project plans.
Resource Load Views
Celoxis’s resource load views give portfolio managers a heat-map-style visual of who is over-allocated, who has capacity, and how utilization shifts week over week. You can filter by department, role, skill set, or project — which means the “who’s available?” question can be answered in seconds, not through a chain of status emails.
Capacity Planning Across the Portfolio
Rather than planning each project in isolation, Celoxis lets you model resource demand at the portfolio level. You can set target utilization thresholds (e.g., cap senior developers at 85% to leave buffer for unplanned work) and immediately see which projects are competing for the same pool of capacity.
Ease of Use in Day-to-Day PMO Work
One of the consistent friction points with enterprise resource management tools is adoption. If project managers find the tool cumbersome, they stop updating it — and a stale tool is worse than no tool. Celoxis is built with this in mind: resource updates, timesheet logging, and allocation changes are straightforward enough that PMs actually do them, which means your forecasts stay grounded in real data.
Watch Celoxis in Action for Project and Resource Management
Explore how Celoxis helps PMOs manage projects, resources, dashboards, reporting, and portfolio execution from one connected platform.
Video: Celoxis project management software demo for PMOs, resource planning, reporting, dashboards, and portfolio execution.

What-If Scenarios: The PMO’s Most Underused Capability
Ask most PMO leaders whether they do scenario planning on resource allocation, and the honest answer is: “We’d like to, but we don’t have time.” The irony is that scenario planning saves far more time than it costs.
What-if scenario analysis in resource forecasting means the ability to ask and quickly answer questions like:
- What happens to our Q3 delivery commitments if Project Titan is approved next month?
- If we move the ERP go-live from September to November, which resource bottlenecks relieve themselves?
- If our lead architect goes on parental leave in June, which projects are at risk?
The Four What-If Scenarios Every PMO Should Model
Pipeline Approval
Which existing commitments are impacted?
Scope Change or Delay
Does the resource conflict move or resolve?
Attrition / Leave
Which projects lose critical skills?
Exec Decision
What must stop if this must start?
Building a Resource Forecasting Culture in Your PMO
Tools matter, but process and culture determine whether forecasting actually improves delivery outcomes. Here’s what separates PMOs that forecast well from those that don’t.
Establish a Weekly Resource Review Cadence
Resource forecasting is not a quarterly planning ritual. It’s a weekly operational practice. The most effective PMOs run a standing 30-minute resource review every week with:
- Utilization snapshots for the next 4–6 weeks
- Flags for anyone exceeding 90% allocation
- Open capacity that can absorb pipeline demand
- Any new commitments that haven’t yet been entered into the system
This is not a long meeting. It is a discipline.
Tie Resource Forecasting to Project Intake
One of the most common failure points: projects get approved without a realistic assessment of whether the organization has the capacity to deliver them. The PMO’s role in intake is to answer the capacity question before the project gets the green light — not after the team is already stretched thin trying to deliver it.
A simple rule: No project gets approved without a resource impact assessment attached.
Create Accountability at the Project Manager Level
Forecasting accuracy degrades when it’s treated as a PMO-only responsibility. PMs need to own their resource plans — updating allocations when scope changes, flagging risks early, and entering actuals consistently. The PMO’s job is to give them the tooling and the process; the PM’s job is to keep the data honest.
Keep Forecasts Grounded in Actual Work
When time tracking and resource planning live together, PMOs can compare planned allocation against actual work without chasing manual updates.
Real-Time Utilization Dashboards: What Good Looks Like
A resource forecast is only as useful as your ability to track variance against it. Real-time utilization dashboards are the PMO’s operational pulse — the difference between managing by exception and managing by surprise.
What Your Dashboard Should Show
| Team | Wk1 | Wk2 | Wk3 | Wk4 | Wk5 | Wk6 | Wk7 | Wk8 |
|---|---|---|---|---|---|---|---|---|
| Dev Team | 82% | 88% | 94% | 103% | 110% | 96% | 79% | 75% |
| QA Team | 70% | 72% | 85% | 91% | 88% | 80% | 65% | 60% |
| Design | 55% | 60% | 75% | 80% | 78% | 72% | 68% | 55% |
| BA / Analytics | 90% | 92% | 95% | 98% | 89% | 85% | 80% | 78% |
Weeks 4 and 5 show clear pressure on the Dev Team and BA/Analytics group. A PMO with this view in Week 1 has time to act. One without it finds out in Week 4 — when it’s already a delivery risk.
The result is a PMO that spends less time assembling reports and more time acting on what those reports reveal.
Manage Deadlines, Budgets, Teams, and Portfolio Delivery in Celoxis
Learn how Celoxis helps PMOs master multi-project tracking by connecting deadlines, budgets, teams, and delivery visibility across the portfolio.
Video: Celoxis multi-project tracking for PMOs managing deadlines, budgets, teams, resources, and delivery performance.
Turn Resource Data Into Decisions
See utilization, capacity gaps, and delivery risks before they derail your portfolio.
Forecast Resources Across the Full Portfolio
Model what-if scenarios, identify bottlenecks, and align resource supply with project demand.
Learn MoreKey Resource Forecasting Metrics Every PMO Should Track
Forecasting discipline means measuring the right things. These six metrics form a solid baseline:
| Metric | What It Measures | Target Range |
|---|---|---|
| Planned vs. Actual Utilization | Forecast accuracy at the individual level | Variance < 10% |
| Resource Utilization Rate | Percentage of available hours allocated to project work | 75–85% |
| Bench Rate | Percentage of workforce unallocated at any given time | < 15% |
| Allocation Accuracy | How close initial estimates are to actual hours logged | > 80% accuracy |
| Time to Fill (Open Demand) | Speed of resolving resource gaps once identified | < 5 business days |
| Forecast Horizon | How far out your resource plan is reliable | Minimum 8–12 weeks |
If you can report on these six metrics weekly, your PMO has a materially better handle on resource risk than the majority of organizations running multi-project portfolios.
Connect Resource Planning With Timesheets and Delivery Data
Celoxis helps PMOs close the loop between planned work, actual effort, utilization trends, and portfolio-level reporting.
