Portfolio management, often referred to as project and portfolio management or PPM isn’t as complicated as one might think. Using Celoxis, you can initiate project requests, develop project scoring model, view project request queues and available resource capacities, achieve desired portfolio balance and track project pipelines and portfolio accounting so that you are always staying ahead of your projects.
Setup
Enable Portfolio feature in your account (Top Menu ▸ ▸ Admin ▸ ▸ ).
This enables the Portfolio section in Projects to capture Alignment, Benefit and Risk parameters for the portfolio. These are the standard attributes we provide for portfolio management.Create a new Project State ‘What-if’ (Top Menu ▸ ▸ Admin ▸ ▸ ).
Keep this state in ‘Planning’ Stage and keep ‘Allow Time’ unchecked. We will use this state to perform rudimentary what-if analysis to arrive at a desired portfolio balance.Import the Project Requests App. (Top Menu ▸ ▸ Admin ▸ Custom Apps ▸ Apps ▸ ).
With this you get a standard out-of-the-box project request workflow. You can customize this workflow to suit your business process. Edit the app and uncheck the “Active” checkbox under Basic tab. This way the app is not available to your users till we set up the rest of the pieces.Develop your Project Scoring model.
Define the additional project attributes that will be potentially important factors to scoring projects. This will be done through custom fields (Top Menu ▸ ▸ Admin ▸ ▸ Custom Fields). Attach these custom fields to all Project Categories and also to the Project Requests App.
In addition to your specific project scoring attributes, you will also need to create the following 3 custom fields and attach them only to the Project Requests App:- - Strategic Alignment (Numeric: 1 to 100),
- - Overall Benefit (Numeric: 1 to 100), and
- - Project Risk (Single-select Drop down: Very High to Very Low).
These are required to match the standard portfolio parameters on the project, so that you can later copy them into your project. Lastly, create a custom formula field “Project Score” that will take in these project attributes and arrive at a potential score for the new project.
Create a ‘Project Requests Queue’ report for viewing your incoming project request pipeline ( ▸ Reports ▸ ▸ ▸ ).
In the Output tab, select ‘Tabular’ and choose all columns that are important for your executive approval. Make sure to include the “Project Score” in the list so that you can directly see the calculated score for each project request in the pipeline.
New Project Requests
Each new project enters the system through a project request. The ‘Project Queue’ report that we created comes handy in viewing the incoming project requests and ranking/re-ranking them based on your criteria.
Go back to your Project Requests App definition (Top Menu ▸ ▸ Admin ▸ Custom Apps ▸ Apps) and mark this as “Active”. Now this app is available to your users for submitting new project requests.
For each of your new projects, create a project request in the system (To add click Top Menu ▸ ▸ ).
Since a project container is not created as yet, create this app within a workspace (if you have defined workspaces) or select non-project (if there are no workspaces in your company). You will have to establish scoring values for each project request and put them in the respective custom fields on the New Project Requests form.As your request is approved, you will need to create a project container for your new project (To add click Top Menu ▸ ▸ Project ▸ ).
Enter the necessary information (such as tentative start date, client, budget, etc.) about this new project in the form. Keep the project in ‘What-if’ state. This way it does not interfere with your other active projects. Additionally, copy over all the scoring parameters from the project request into the project’s portfolio section and the defined custom fields.Now move the project request associated with this new project under the project itself (Go to the said ProjectRequests item ▸ ▸ and select the new project from the list). This way, the approved request stays within the project’s repository.
Desired Portfolio Balance
Now that you have created all your project containers, you will need to validate them against your available resource capacities and revise them based on resource availabilities, priorities and strategic importance.
Check available resource capacities. Go to ▸ Reports ▸ ▸ . This is a built-in report that gives you insights into your organizational resource capacities for the near future. Looking at this report you can get a good idea of how your existing resources are stacked up to take in the new projects in your portfolio. You can increase the default period in the report to get farther insights into your resource capacities. You can also search for resources with specific skillsets by using the “Resource: Search” filter.
Now, for each project, define the WBS and resources. Since the project is in ‘What-if’ state, it will not affect your existing project workload. Open the Resource Load View ( ▸ ). From the filters, add ‘What-if’ to your Project State filter. Now your Resource load will start showing your new projects in addition to your draft and active projects.
Use the Resource Load View to conduct a rudimentary what-if analysis to understand the impact of your new projects onto the existing resource load.
From the Resource Load View, you can
- Check if there are any resourcing problems
- You can replace resources, if necessary. Mouseover the task in contention, and select the ▸ .
- You can also shift out tasks by changing their dates (Mouseover the task ▸ )
If you still have a resourcing issue, change the start date of the other low priority projects so that all other tasks in those projects are rescheduled. However, please note that Celoxis does not currently support an UNDO feature. If you need to revert, you will have to manually revert the project to its earlier state.
Portfolio Reports
Celoxis gives our several best practices portfolio reports for managers and executives that you can use out-of-the box. You can also create your reports.
Budget Allocations
This is a bar chart report that lays out budget allocations per manager aligned by their projects’ start month and year. This gives a visual insight into your approved budget allocations for managers and their projects.
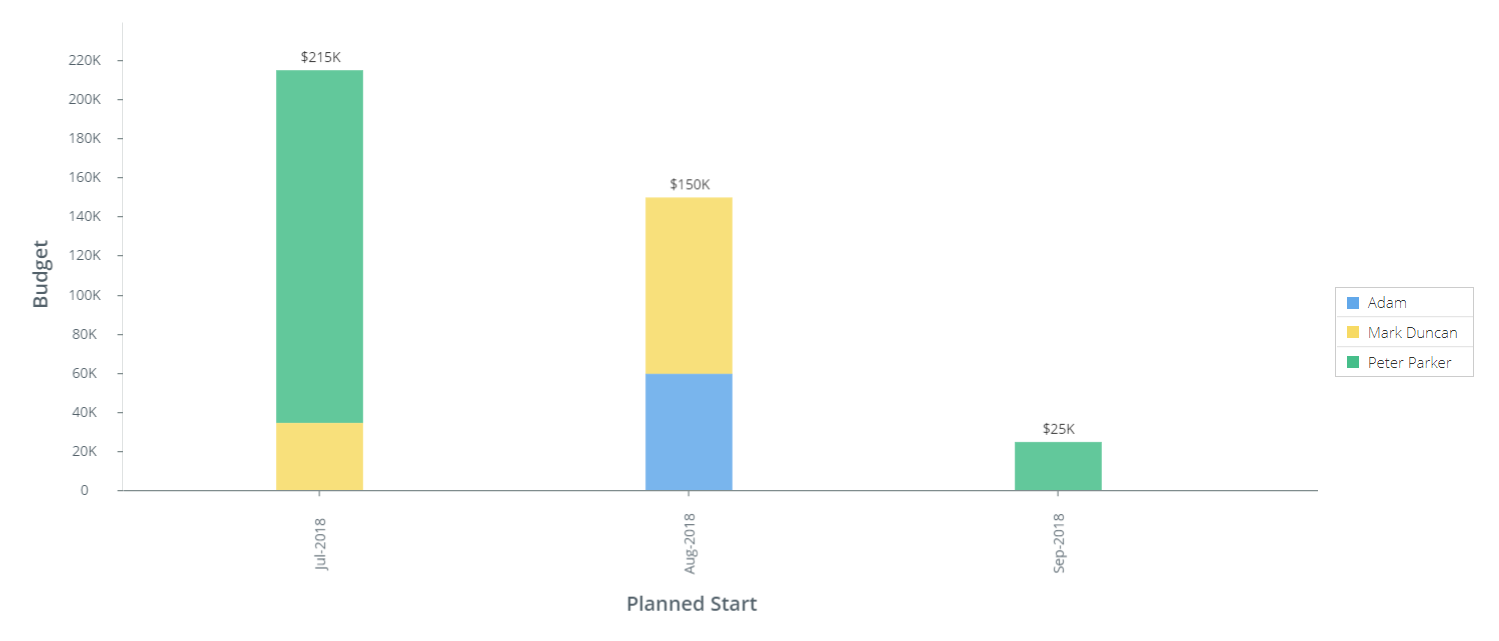 Budget Allocations
Project Portfolio Analysis
This bubble chart gives you a good 30,000 feet overview of how your projects are aligned with organizational strategy and financial or operational benefit. The color coding on the bubbles indicates the perceived risk from the project.
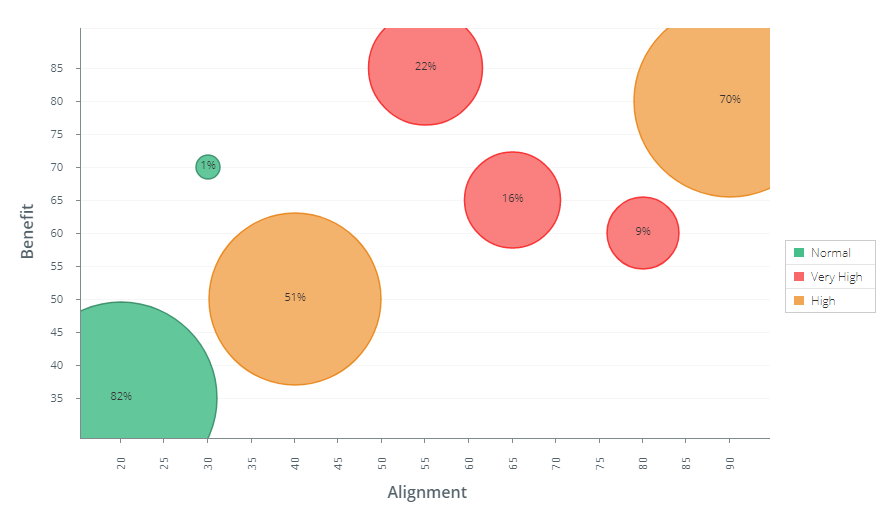 Project Portfolio Analysis
Projects (By Schedule)
This is a tracking report that gives you an overview of all projects in your portfolio and their schedule status.
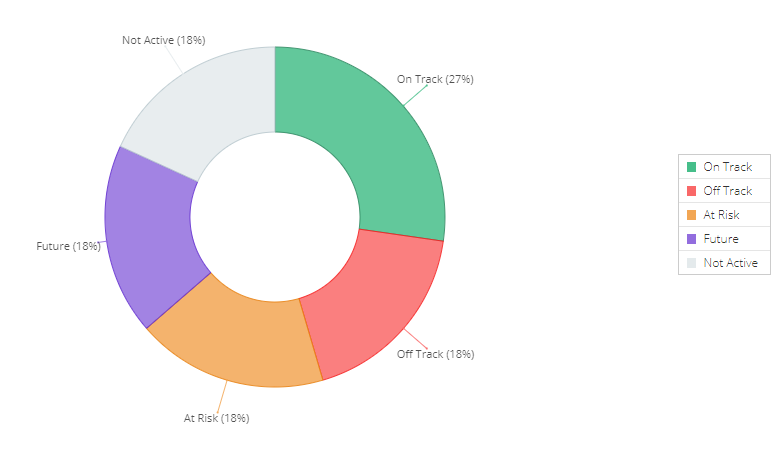 Projects (By Schedule)
Project Status (Gantt)
This is timeline view of all projects in your portfolio. Again a tracking report, and gives managers and executives a good overview of how the projects and their top-level tasks are lined up with their schedules.
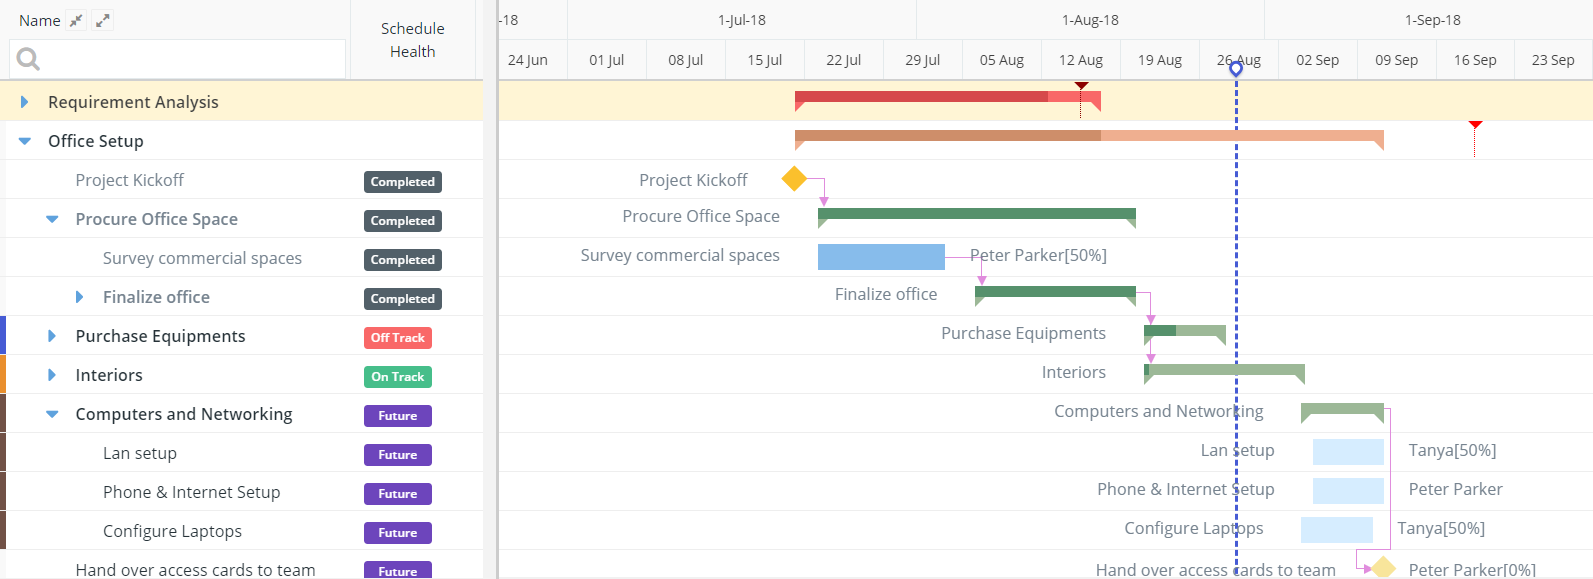 Project Status (Gantt)
Cost Overrun
Cost Overrun is a tabular report that identifies projects whose actuals costs have exceeded their estimated costs.
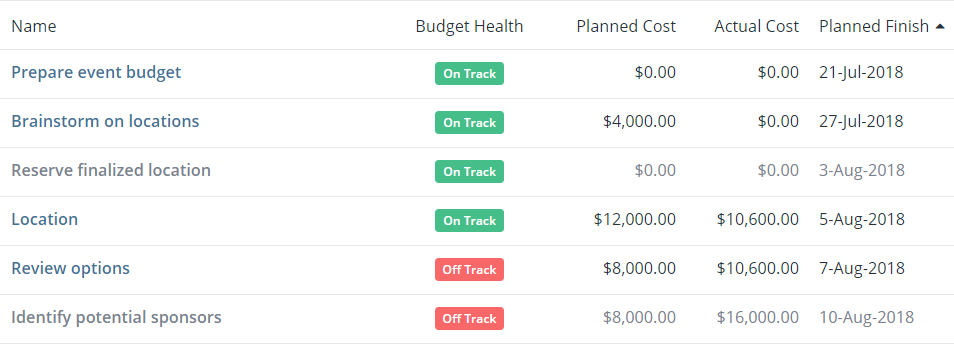 Cost Overrun
Resource Capacity
With this time-phased report, executives and project approvers can get a clear picture of your resource capacity at any point and make better resourcing decisions for new projects.
Planned Capacity (%) = 1 − Planned Utilization
Actual Capacity (%) = 1 − Actual Utilization
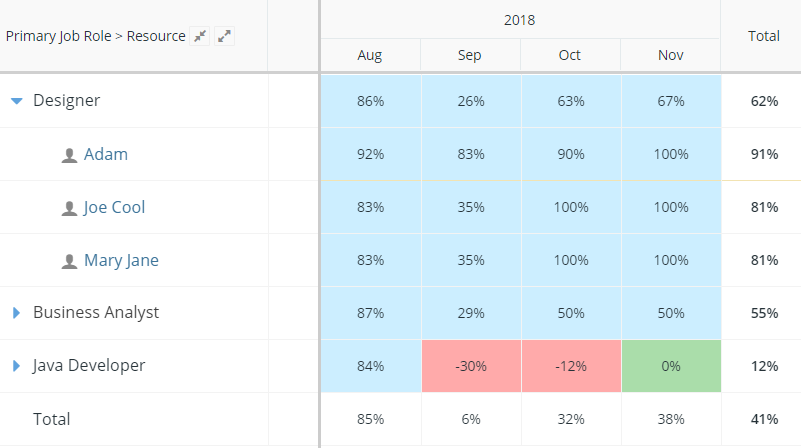 Resource Capacity
Resource Utilization
This report can help track the utilization of resources against the plans.
Planned Utilization (%) =  ÷ Available Hours
Actual Utilization (%) = Actual Effort ÷ Available Hours
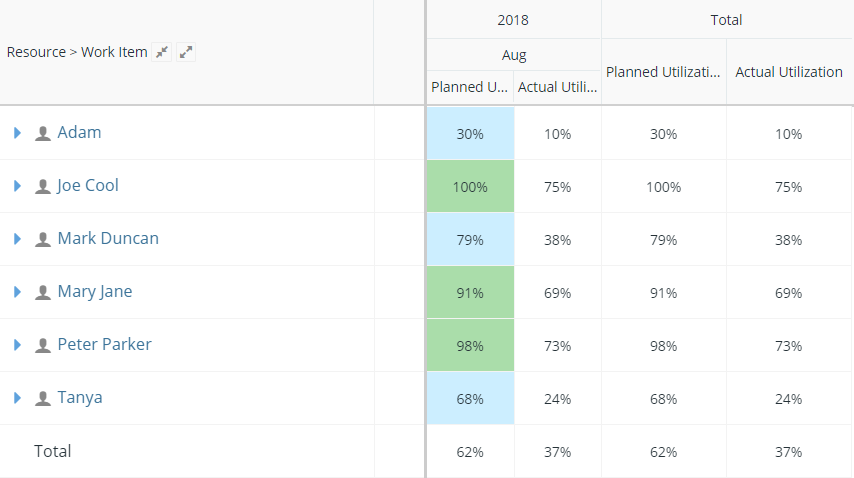 Resource Utilization
Resource Efficiency
This is an excellent report for monitoring resource performance.
Efficiency (%) = Planned Effort ÷ Actual Effort
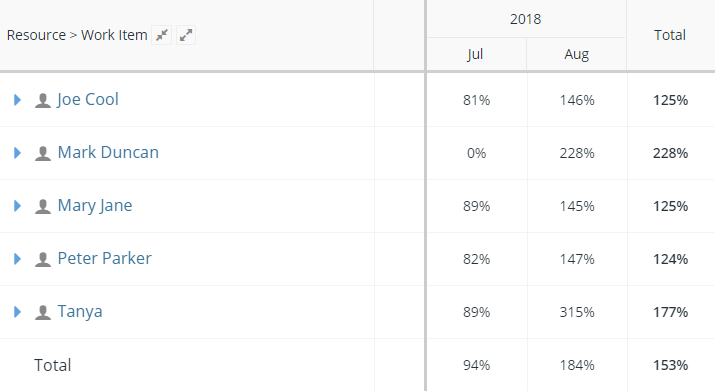 Resource Efficiency